This is a post somewhat outside my areas of expertise. I have modeled kinetics in the past, and the math here isn’t particularly complicated, so I’m not too worried there. I’ve looked at test results covering tens of millions of hours. My biggest concern is that, because I’m not a materials scientist or otherwise industry-adjacent, I simply haven’t encountered some relevant data or information due to paywalling and/or Google obscurity. Hopefully not, but also not betting my life on that. Continue reading accordingly.
As a quick digression, in case I’m getting any “the government uses these standards, so they must be accurate” readers, let’s look at Artificial Sweetener labeling. Despite a cup of Splenda having more calories than a cup of blueberries, despite being ~90%+ rapidly-and-easily-digestible carbohydrates, and despite having ~90% of the caloric content of regular table sugar gram-for-gram, it’s legally allowed, via multiple layers of complete bullshit, to advertise Splenda as a “zero calorie food” and to put “0 calories” on the nutrition label on a bag/box/packet. This isn’t due to the FDA not knowing that maltodextrin has calories or any other such form of ignorance. It’s the FDA literally creating a known-to-be-bullshit standard to create a known-to-be-bullshit Official Number for the sole purpose of allowing decades of deliberately deceptive marketing. Official Numbers created from Official Procedures are simply Official Numbers and need bear no resemblance to the actual numbers, and this situation can persist for decades even when the actual numbers are known beyond all doubt to be very different. That’s a good thing to remember in many contexts, but it also applies here.
Ok, so, back to LED testing. LED light sources can (legitimately) last for tens of thousands of hours, sometimes over 50,000 hours. Given that there aren’t even 9000 hours in a year, doing a full lifetime test would take over 5 years, and waiting to sell products until the tests are complete would mean only selling ancient products. In a fast-moving field with improving design technology, this doesn’t do anybody any good, hence the desire to do partial testing to extrapolate a useful lifetime.
This is a fine idea in theory, and led to the LM-80 and TM-21 standards. LM-80 is a measurement standard, and for our purposes here, it basically says “run the bulb constantly under some specified set of conditions and measure the brightness of the bulb for at least 6000 hours total and at intervals no greater than every 1000 hours”. Sure, fine for what it is.
TM-21 is a calculation standard that uses the LM-80 data. It says, effectively, “take the last 5000 hours of data, or the second half of the test run, whichever is longer, and fit to an exponential decay curve. Extrapolate forward based on that”. This is where the problems start.
Light sources can fail in multiple ways, either “catastrophic” complete failure, like when the filament on an incandescent bulb finally snaps and the bulb instantly transitions from great to totally useless, or by gradually dimming over time until it’s not bright enough anymore. LEDs themselves generally fail by the latter mechanism, and the threshold failure is defined to be 70% of initial brightness (based on research that I haven’t examined that shows that people are generally oblivious to brightness drops below that level). So, roughly, fit the LM-80 brightness data to an exponential decay curve, see how long it takes that curve to decay to 70% brightness, and call that the lifetime (with another caveat not to claim lifetimes tooooo far out, but that part isn’t relevant yet). Numbers besides 70% are also reported sometimes, but the math/extrapolation standard is the same so I won’t worry about that.
Using LM-80 + TM-21 lifetime estimates relies on several important assumptions that can all fail:
- Long-term lumen maintenance (beyond the test period) follows an exponential decay curve down to 70%
- Lumen maintenance inside the test period, what goes into the TM-21 calculations, also follows an exponential decay curve with the same parameters as #1.
- LM-80 data collection is sufficient, in both precision and accuracy, to allow proper curve fitting (if #2 is true).
- Test conditions are representative of real-life conditions (or the difference is irrelevant)
- Other failure modes don’t much matter for the true lifetime
In my opinion, ALL of these assumptions fail pretty clearly and substantially. Leaving #1 until last is burying the lede a bit, but it’s also the messiest of the objections due to an apparent shortage of quality data.
Going in reverse order, #5 can be a pretty big problem. First, look at this diagram of an LED bulb. The LM-80/TM-21 standard ONLY REFERS TO THE LED, NOT TO THE BULB AS A WHOLE. The end consumer only cares about the bulb as a whole. There’s an analogous whole-bulb/whole-product standard (LM-84/TM-28), but it’s mostly optional and seems to be performed much less often/reported publicly much less. For example, ENERGY STAR(r) certification can be obtained with only LM-80/TM-21 results. It is estimated (here here and other places) that only 10% of full-product failures are from the LED. These products are only as good as their weakest link, so good LEDs can be packaged with dogshit secondary components to produce a dogshit overall product, and that overall product can easily get certifications and claim an absurdly high lifetime just based on the LED. Trying to give an exact overall failure rate is pointless with so many different brands/designs/conditions, but simply googling LED failure rate should make it abundantly clear that there are problems here, and I have a link later where around 30% of products failed inside 12,000 hours.
For some applications, like normal screw-in bulbs, it really doesn’t matter that much. Any known brand is still (likely) the best product and the replacement costs are pretty trivial- buy a new bulb and screw it in. However, for other applications… there are scores of new products coming out of the Integrated LED variety. These, uh, integrate the LED with the entire fixture and often require complete replacement upon failure, or if you’re luckier, sourcing special spare parts and possibly working with wiring or hiring an electrician. In these cases, it’s *extremely* important to have a good idea of the true lifetime of the product, and good luck with that in general. I’ve looked at a few residential and commercial products and none of the lifetime claims give any indication of how they’re derived. One call to an electrician when an integrated LED fails completely obliterates any possible longer-lifetime-based savings, so if you can’t do the replacement yourself, it’s probably wise to stick to conventional fixtures and separate LED bulbs.
Even if LM-84/TM-28 replaced LM-80/TM-11, there would still be problems, and the remaining points apply (or would apply) to both. Continuing with point #4- testing conditions not matching real-life conditions. While this is clearly true- test conditions have an isolated LED running 24/7 at a perfectly controlled constant temperature, humidity, and current, while real life is the opposite of that in every way, the question is how much it matters.
Fortunately, I found this document after writing the part above for problem #5, and I came to the same conclusions as the author in did in their section 2.4.2, and I may as well save time and just refer to their 2.4.3 for section 4. TL;DR operating conditions matter. On-off cycling (when the system has at least an hour to cool down to ambient temperature before heating back up) causes important amounts of thermal stress.
On to point #3- the accuracy and precision of the gathered data. I don’t know if this is because testing setups aren’t good/consistent enough, or if LEDs are just a bit weird in a way that makes the collection of nice data impossible or highly unlikely, but the data is a bit of a mess. As a reminder, the idea is to take the final 5000 hours (or second half of the data set, if that’s longer) and fit it to an exponential decay curve. It’s already a bit of a tough ask to parameterize such a curve with much confidence over a small luminosity change, but there’s another problem- the data can be noisy as hell and sometimes outright nonsense. This dovetails with #2, where the data actually need to inspire confidence that they’re generated by an exponential decay process, and it’s easier to look at graphs one time with both of those considerations in mind, as well as one more. Any test of >6000h is acceptable, so if this procedure is valid, it should give (roughly) consistent estimates for every possible testing window depending on when the test could have been stopped. If this all works, 1000-6000h should give similar estimates to 5000-10000. A 10000h test isn’t just a test of that LED- it allows a test of the entire LM-80/TM-21 framework. And that framework doesn’t look so hot IMO.
For instance, look at the graphs on page 8/10/12 in this report. Three of the curve fits (52,54,58) came out to exponential GROWTH of luminosity. Others are noisy as hell and nowhere near the trend line. The fit of the dark blue dots on each graph are wildly different from 2000-7000 vs 5000-10000. This has one exponential growth fit and assorted noise. Pages 33-34 would obviously have no business including the 1000h data point. This aggregate I put together of 8 Cree tests (80 total bulbs) has the same general problem. Here are the individual runs (10 bulbs for each line). There are more like these. I rest my case.
Even the obvious nonsense exponential growth projections are considered “successful” tests that allow a long lifetime to be claimed. Standard errors of individual data points are, in aggregate, above 10% of the difference between adjacent data points (and much worse sometimes in individual runs of course). It has been known forever that LEDs can behave differently early in their lifetime (for various materials science reasons that I haven’t looked into), which is why the first 1000h were always excluded from the TM-21 standard, but it’s pretty clear to me that 1000h is not a sufficient exclusion period.
Last, and certainly not least, is the question of whether or not the brightness decay to 70% even is exponential, or for that matter, if it’s accelerating, decelerating, or roughly linear over time once it gets past the initial 1000h+ nonsense period. Exponential would just be a specific class of decelerating decay. There appears to be an absolutely incredible lack of published data on this subject. The explanation for the choice of exponential decay in the TM-21 standard is given starting on page 17 here, and holy hell does that not inspire any confidence at all.
I’ve only found a few sources with data that goes past 15,000 hours, all listed here. There’s probably something else out there that I haven’t been able to find, but the literature does not appear to be full of long tests. This is a government L-Prize experiment, and figure 7.1 on page 42 is clearly concave down (accelerating decay), although the LED is likely going to last a lot longer regardless. Furthermore, the clear winner of the “L-Prize” should be the person responsible for the Y-axis choice. This paywalled article goes out to 20,000h. I don’t want to post the exact figure from their paper, but it’s basically this and clearly concave down. This, also paywalled, goes 60,000 hours(!). They tested 10 groups of 14 bulbs, and all 10 groups were clearly concave down over the 15,000-60,000h period.
And if you parsed the abstract of that last paper quickly, you might have realized that in spite of the obvious acceleration, they fit the curve to.. a decelerating decay model! Like the Cree tests from a few paragraphs ago, this is what it looks like if you choose to include data from the initial nonsense period. But for the purposes of projecting future life, we don’t care what the decay shape was at the beginning. We care what the decay looks like from the test window down to 70%. If the model is exponential (decelerating) decay and reality is linear, then it’s still clear that most of these LEDs should last a really long time (instead of a really, really long time). If degradation accelerates, and accelerates fast enough, you can get things like this (pages 12-16) where an LED (or full bulb in this case) looks fine and then falls off a cliff far short of its projection.
Unlike the case with Splenda, where everybody relevant knows not only that the Official Number is complete bullshit, but also what the true number is, it’s not clear to me at all that people recognize how incorrect the TM-21/28 results/underlying model can be. I feel confident that they know full-bulb results are not the same as LED results, but there are far, far too many documents like this DOE-commissioned report that uncritically treat the TM-21 result as the truth, and like this project whose stated goal was to see if LED product lifetime claims were being met, but just wound up doing a short test, sticking the numbers in TM-28, and declaring that the LED products that survived passed without ever actually testing any product to even half of a claimed lifetime, sometimes not even to 25% of claimed lifetime. There appears to be no particular effort anymore to even try to ascertain the true numbers (or the approximate veracity of the Official Numbers). This is unfortunate.
There is another family of tests that can reveal information about performance degradation without attempting to quantify lifetime, and that’s the accelerated degradation test. Parts or products are tested in unfriendly conditions (temperature/temperature variability, humidity, high/variable current, etc) to see what degrades and how quickly. Even the power cycling test from just above would be a weak member of this family because the cycling was designed to induce repeated heat-up-cool-down thermal stress that doesn’t exist in the normal continuous operation test. Obviously it’s not good at all if a bulb craps itself relative to projections as a result of being under the horrifically unrealistic stress of being turned on and off a couple of times a day.
These tests can also shed light on whether or not decay is decelerating, constant, or accelerating. This picture is a bit more mixed. Although there are some results, like the one in the last paragraph and like the last figure here that are obviously hugely accelerating, there are others that aren’t. I tried to get a large sample of accelerated degradation tests using the following criteria:
- Searching Google Scholar for “accelerated degradation” led testing luminosity in 4-year chunks (2019-2022, 2015-2018, etc. The earliest usable paper was 2007)
- Taking any English-language result from the first 5 pages that I could access that was an actual physical accelerated degradation test that applied a constant stress to a LED or LED product (there were some that ratcheted up stress over time, OLEDs not included, etc)
- Tested all or almost all samples to at least the 30% degradation cutoff and plotted actual luminosity vs. time data on a linear scale (so I could assess curvature without requesting raw data)
- Didn’t have some reason that I couldn’t use the data (e.g. two experiments nuked the LEDs so hard that the first data point after t=0 was already below 70% of initial luminosity. Can’t get curvature there)
I assessed curvature in the 90%-70% range (I don’t care if things decelerate after they’re functionally dead, as the power-cycling bulbs did, and that seems to be common behavior) and came up with:
3 clearly accelerating (plus the power-cycling test above, for 4), 4 linear-ish, and 2 clearly decelerating. One of the decelerating results was from 2007 and nuked two of the samples in under 3 hours, but it fit my inclusion criteria, so it’s counted even though I personally wouldn’t put any weight on it. So, besides the amazing result that a couple hundred google results only produced 9 usable papers (and maybe 3 that would have been ok if they weren’t plotted on log scale), there’s no evidence here that a decelerating decay model is the right choice for what we’re trying to model.
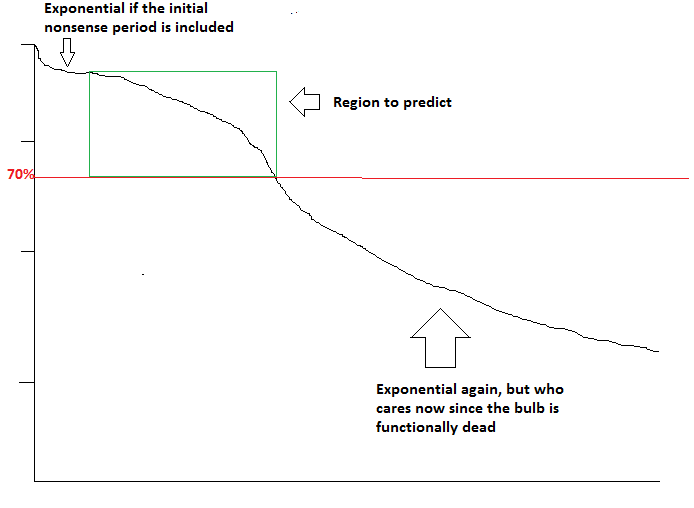
It looks to me like the graph above is a common degradation pattern, and instead of fitting the region to predict, which is hard because who even knows what functional form it is and when to transition from initial nonsense to that form, people/TM-21/TM-28 use too little data at the beginning and decide it’s exponential, or include too much data after the bulb is quite dead and also decide it’s exponential, even though there’s not much evidence that I can find to support that the region to predict is actually exponential, and there’s plenty of evidence that I’ve found to contradict that.
There needs to be a concerted data-gathering effort, not just for the sake of this technology, but as a framework for future technologies. It should be mandatory that whole-product tests are run, and run under reasonable operating conditions (e.g. being turned off and on a couple of times a day) and under reasonable operating stresses- humidity changes, imperfect power supply, etc. before any certification is given, and no lifetime claim should be allowed that isn’t based on such a whole-product test. There should be a separate certification for outdoor use that requires testing under wide ranges of ambient temperatures and up to 100% humidity (or for other special environments, testing under near-worst-case versions of those conditions). The exact details of how to run accelerated degradation tests and correlate them to reasonable lifetime estimates isn’t a trivial problem, but if we’d spent the last 15-20 years running more useful tests along the way, we would have solved it long ago. If we’re handing out grant money, it can go to far worse uses than this. If we’re handing out long-life certifications to big manufacturers, they can pay for some long-term validation studies as a condition. This is true for almost any new technology that looks promising, and not already having such an automatic framework in place for them a long time ago is quite the oversight.
