The funny part is that I was looking at this just before WotC announced that OTJ was going full bukkake with 2 different bonus sheets plus even more Special Guests. At this point, with the release of OTJ, about *half* of the ~960 different Mythics on Arena are either literally or effectively uncollectible from store packs. That’s beyond insane.
(My counts are going to be a little off because Scryfall didn’t have perfectly up to date info when writing- it had OTJ, but didn’t know that Stoneforge Mystic is on Arena, etc., and I’m not checking everything by hand because the point I’m making isn’t at all dependent on near-perfect accuracy)
Once WotC announced Mythic packs a little over 2 years ago, you’d think that you’d just be able to spend 1300 gold and get a Mythic from whatever set you’re after. Or at least you’d be able to the vast majority of the time. And if you did think that, you were horribly, horribly mistaken.
First off, WotC sometimes just… didn’t implement Mythic packs. The first 8 regular sets (up to M20), Kaladesh Remastered, Amonkhet Remastered, all of the non-standalone Alchemy sets, and MoM: Aftermath don’t have Mythic packs available for purchase. Why? Who knows. It makes no sense. This puts 60 recent Mythics (MAT+Alchemy) and ~170 older Mythics behind a pay gate where the only way to buy them with in-game currency is to buy that set’s regular packs (far) beyond the point where you’re rare complete and they’re just giving 20 gems most of the time, making them effectively uncollectible without spending wildcards. (you can also wait a month to collect a new regular set, overbuy alchemy packs until alchemy-mythic-complete without running into base-set rare completion, then finish the base set, but that still sucks and only addresses 1/4th of the problem)
Second, there are another ~67 promo and/or commander Mythics associated with particular sets that simply aren’t openable in that set’s store boosters. They aren’t even pay-gated behind almost-worthless packs- they’re truly wildcard-only. Why? Again, it makes absolutely no sense. Not having them in *draft* boosters makes sense, but Arena store boosters are a unique digital thing that has never mirrored paper- they have a different number of cards, sometimes different frequencies or different available cards, and hell, sometimes the slots aren’t even filled with cards! Why not have them drop with the lowest priority (after everything else and down with the banned cards, etc.)? Another easy fix.
And third, we have the absolute grade-A bullshit that is Arena bonus sheets. Bonus sheets (before BIG, which may be a one-off) can mostly be ignored in paper because all of the cards they contain have already existed in normal printings, so it doesn’t often matter if they’re ultra-rare in this printing. A new-to-arena bonus sheet Mythic is effectively uncollectible. For example, it would take opening **540** SoI:Remastered store packs on average to open a **single copy** of Geist of Saint Traft from the Shadows of the Past bonus sheet. Absolute bullshit. There are about 100 of these, and all of them except the 14 from Strixhaven’s Mystical Archive are from the last year and a half. It has gotten completely out of control. Goodbye to hundreds of Mythic wildcards if you try to keep up.
And on top of that, a BIG mythic drops in paper Play boosters in 18.4% of packs (1 in 5.4), a bit more frequently than a normal OTJ Mythic (edit: because there are 30 of them compared to 20 OTJ Mythics, each individual card drops slightly less often- 1 in 140 packs for each OTJ Mythic, ~1 in 160 paper packs for each BIG Mythic), and that slot is in addition to the base-set rare slot. WotC actually tried to make the paper BIG cards reasonably available because they knew they needed to do that with a first printing. In Arena store packs, a BIG Mythic drops in 1 of every **35** non-wildcard packs instead of 1 in 5.4 (1 in 1050 packs for an individual card instead of 1 in 160), and it replaces the regular Mythic. Why? Because fuck you twice, that’s why.
Fourth, you have the other ~70 Mythics that were never available in store packs and are wildcard-only now- Special Guests, Anthology cards, Jumpstart exclusives. Some were reasonably collectible for a short time, others not so much, but they’re all impossible now.
This is all trivially fixable- if the plan were to ever fix anything instead of looking for new places to nerf Mythic drop rates by a factor of 7. Fully implement Mythic packs as should have been done 2 years ago. Put promo/commander cards down with banned cards at the end of packs. Have the rare(mythic) slot in a store pack give a bonus sheet/list/SPG rare(mythic) instead of gems when you’re rare(mythic) complete in the base set. That’s 90% of the uncollectible Mythic problem solved right there, and the other 10% isn’t that hard if you’re a little creative, and also doesn’t matter that much without the other massive Mythic wildcard drains running wild.
I’d noticed things weren’t right in November 2023, and according to other people, things had appeared different for a couple of months before that (I had played very little ranked). After investigating further, it appears that the core system is largely the same while the actual calculation module is now just three bugs in a trench coat.
What doesn’t seem to have changed:
There’s a cap of 1650 MMR when ranking in each month and you have to either be very new to ranked or expend effort to rank in well below that, and it’s (almost certainly) still based on your Serious Rating.
Games against other Mythics are capped at a 200 MMR difference for rating calculations regardless of how wide the difference is.
Games against non-Mythics are rated as though you’re 100 points above the non-Mythic, regardless of what your MMR is.
MMR doesn’t drift over time
Bo3 matches are worth twice as many points as Bo1
Mythic is run at a fixed Rating Deviation- even though the system is likely still trying to be Glicko-2, Mythic RD doesn’t change with played matches
What has definitely changed:
Bo1 matches against somebody 200+ points lower used to be +5 points for a win and -15.5 points for a loss for a breakeven winrate of 75.6%. Now this is +3.8 points for a win and -5.9 points for a loss for a breakeven winrate of 61.1% and many fewer points at stake.
Bo1 matches against a non-mythic used to be -13 points for a loss and +7.4 points for a win for a breakeven winrate of 63.7%. Now this is -5.4 points for a loss and +4.3 points for a win for a breakeven winrate of 55.6% and many fewer points at stake.
Even though I consider it highly likely that this output is just the result of silly bugs, this system does fix the Mythic limited rating problem, albeit in a quite dumb way. Reducing the number of points at stake in each match is also probably a good thing. On the flip side, only needing a 55.6% breakeven rate against non-Mythics in constructed is even more advantageous than before, and having a 61.1% maximum breakeven against all Mythics in constructed is downright atrocious. Approximately, to compete for #1/very high mythic in constructed before, you needed to maximize #gamesplayed * (winrate – 75.6%), and having a sustained winrate much over 75.6% in high-ish Mythic is fairly difficult. Now the formula is approximately #gamesplayed * (winrate – 61.1%), which lets mediocre-winrate players reach very high mythic just by playing a lot.
The other interesting question- to me, at least- is where the hell any of these numbers come from. The system definitely isn’t Elo, and there’s no simple way I see to bastardize Glicko-1 to give these outputs, and the 100/200 point things still seem untouched, so I figured the simplest possibility was that it was likely to be some kind of Glicko-2 modification. In any Elo-like system, a matchup between players with particular ratings can be characterized in two ways- the obvious one being the points gained or lost based on a win/loss, and the other on the ratio between the win/loss that determines the breakeven winning percentage. -15.5/+5 and -31/+10 have half/double the points at stake, but the same breakeven percentage.
In Glicko-2, the knob to adjust the breakeven percentage for a fixed rating difference is the rating deviation, which is a measure of how uncertain the ratings are. Under the old Mythic system with a RD of 60, 200 points was a 75.6% breakeven. Lowering that to 61.1% would require increasing the rating deviation to about 741.5, and given that the value for a completely unknown player is initialized at 350 (remember that number), it seemed almost impossible that 741.5 could have been coded in. And that would have given 77.2 times as many points out (454.8 vs. 5.9), which is another nonsense number. So that seemed unlikely. Getting the points given out to decrease to anything like the new low numbers required massively reducing the RD, but that only made the breakeven winrate higher than 75.6%, so that wasn’t any good either.
Basically, these numbers aren’t even close to normal Glicko-2 numbers- reducing the points at stake would require increasing the already-far-too-high breakeven percentage, and reducing the breakeven percentage would require increasing the already far-too-high points at stake. I didn’t have any great ideas- I’d noticed that the a 200-point difference under the new system was close to an 80-point difference under the new system, as far as breakeven goes, which was about a factor of 2.5. I was looking at the Glicko-2 algorithm to see if there were anything they could have plausibly screwed up to account for that, and.. Glicko-2 has a scale constant of ln(10)/400 that ratings (and RDs) are divided by. If they’d miscoded that as the base-10 logarithm instead of ln(10), that’s a factor of about 2.3. So I coded that mistake into my Glicko-2 algorithm and checked what rating deviation I would need the players to be to come out with the 61.1% breakeven.. and the answer came back.. you guessed it.. 350! (350.36). That’s an almost impossible coincidence- that the RD to get the observed breakeven % after using the incorrect logarithm would come out at almost exactly the new-player initialization level (which they actually do/did use to initialize the play and serious ratings for actual new players).
So if we assume that’s what the algorithm is doing- using the wrong logarithm and the wrong RD initialization value (Mythics used to initialize at RD 60, which is somewhat reasonable, not 350)- how do we get from there to the actual point values? That would give out far too many points- 147.6 vs 5.9- but in this case, the multiplier is almost exactly a nice round number, 25 (25.02).
I don’t know if there’s a third huge bug that mimics a divide-by-25 in rating changes, whether somebody put in a divide-by-25 to get reasonably-sized numbers in lieu of actual debugging, or if this is all part of some new system and the log(10)/350 thing is just a total coincidence, but it’s hard to imagine somebody went to the trouble of completely redesigning the Mythic rating system and ended up with.. this.
*I can’t reproduce the point values exactly using any values for scale constant, initial RD, and multiplier, but I couldn’t exactly match the values before this change either. It seems fairly likely that there’s another smaller bug somewhere in their algorithm, and/or a large bug that’s mimicking divide-by-25 somehow.
Well, at least not without enough ancillary rules that the effect of stance would be greatly minimized. I learned from this article (and assuming for this post that the description within is accurate) that the ABS system in the minors recently switched from a player-height-based zone to determining a zone by actually measuring (a rolling average of) a batter’s actual stance. It should have been obvious that such a system would be completely untenable in MLB.
The system measures the zone as the crook of the knee to a baseball’s height above the belt. I, a not particularly flexible guy, can adopt a deep squat and get a strike zone of maybe an inch in vertical dimension by that definition. Of course I couldn’t swing with any power standing like that, but why would I ever swing when I could be a much better offensive player than prime Barry Bonds just by standing still and walking over 90% of the time? There’s clearly a problem here. (as well as the similar exploit of jumping with the pitch and drawing your knees up to get a small and absurdly high zone)
Amusingly enough, this system might come close to working as-is in exactly the minor leagues because W-L record isn’t that important, no players want to stay there, and a bullshit-fueled .900+ OBP isn’t going to get you called up to the show, so there’s no incentive for players or teams to go all-in on gaming the system. At the MLB level where the incentives are the exact opposite- winning is hugely important and you’re not likely to get sent down to AAA for doing it via bullshit, absurd stances should appear immediately.
And the problems aren’t limited to just completely refusing to ever engage with any pitched ball- copping a squat any time you’re going to take anyway- and you have time to present a normal stance and then squat between the start of the delivery and the ball reaching the plate when the measurement is made- would be enough to significantly shrink your overall zone. I could definitely see this kind of exploit happening even in the minors.
So, clearly, this situation wouldn’t be allowed to happen (or wouldn’t be allowed to last if MLB is somehow obtuse enough to actually implement the current AAA version), so how would it be prevented? Well, there would need to be a minimum vertical zone size, and to prevent absurdity, it’s also likely that the bottom of the zone would have a minimum and maximum height off the ground. And what could those be based off of? Player height, or some kneecap/navel measurement or something, and not much else.
Once you have a minimum vertical zone size (for a given player height), having any variability in that size still incentivizes absurd stances on as many takes as possible, and nobody wants to have to do that (or feel like they should do that) or to regularly see it. So the vertical zone size (for a given player height) should fairly clearly not depend at all on stance. As to the last question, where the zone is actually located, stance could possibly play a role there. I don’t think it’s a great idea to anchor the bottom of the zone based on historical stance, but I expect it’s what will happen for inertial reasons, and using stance only to determine the bottom of a defined-size zone isn’t a total disaster.
Gartenbau (4 plays, 2.5+/4) I actually didn’t like this game very much the first time I played it- we were using the advanced tiles and it was a bit too much- but after a couple of plays with the basic tiles and a return to the advanced tiles, this game is actually a pretty good tableau puzzle and it plays pretty crisply. Every turn is a decision of what to value more, planning is rewarded at multiple levels, etc. The seedling runout is random, but between being able to pay to skip spaces and being able to take a turn off of resource gathering to buy/build something, it doesn’t feel like there are too many useless turns, and there’s huge agency anyway in minimizing the number of potential turds. The one thing I’m not sure about is how much balance there is among various flower combinations. Some don’t work at all together (e.g. holes+rectangle), and some work quite well (e.g same-type surrounding+contiguous area), but given that you aren’t likely to build all of your flowers anyway in advanced mode, it may be that you usually have at least one reasonable subset to go after. If train-wreck draws aren’t very common, then I’d probably bump this up to 3.0 or 3.5. It feels sneaky good. Having the small seedling/plant icons being so damn small is annoying though, and the two purples are too close together for something that tiny. That just adds mental overhead for no good reason.
Everdell (3 plays, 2.5+/4) Castles of Burgundy to a lesser extreme. The game is pretty fun, but it has issues- free cards showing up or not can be game-changing, balance doesn’t seem particularly great, you can get train-wrecked if you can’t find production early, but it’s still mostly fun. Except for trying to read the fucking cards. It’s simply impossible. I can read the fine print on a sweetener packet at arm’s length with no problem. I can’t come close to reading the partner card print in the meadow without picking the cards up. Also, the costs are printed on a picture background (instead of a static background like Magic or Pokemon or Ark Nova) that makes reading them extremely difficult, and open-closed spaces iconography, holy shit. I don’t even have words. There used to be contests to make the worst possible UI. This is on par with the winners. We house-ruled out open spaces in tableaus because nobody can see them (and it’s just a stupid and unnecessary idea anyway). The tree is so extra that it made me use “extra” for the first time, and on top of that it’s actively detrimental to gameplay (having the mission cards elevated makes them harder to read and having jumbled game pieces instead of a defined/segmented area on the board makes it harder to verify seasons). It’s still good. It’s just annoying that it wouldn’t have taken much at all to use better game pieces for a significantly better/less frustrating experience, and it shouldn’t have been hard at all to get that information/feedback (or to just start off imitating similar elements in card games that have done it well for decades).
Canvas (4 plays, 2.5/4) The basic idea here is simple and brilliant. There are good puzzles to solve in trying to put various pieces together to meet objectives. The scoring is good. People seem to enjoy the pictures and names (I don’t personally care much, but it’s not a negative). This would be like a 3.5 or maybe even a 4.0 if a couple of things got fixed. The card flow is simply too slow and the low easel count means that you’re picking the first card almost all the time, the second card occasionally, and a higher card maybe once per game. If the market were such that either of the first two cards were free, the third card cost one (easel placed on the second card, etc), and the oldest remaining card in the market got discarded every turn, this would work better. The elephant in the room though is objective balance. We drew the 2 triangle mission, and I was to the left of a good gamer who’d never played before and 2 to the left of a competent gamer who had. The other two were fairly random players. I was almost sure I couldn’t win because they’d be smart enough to bogart triangles in general and any double-triangle card like it was made of gold, and that’s what happened. I had to struggle to even get one for the “at least one of each type” mission. A lot of the missions support everybody going for them at the same time. The missions that don’t, like 2 triangles, also don’t hugely impact the ability to go for the more general missions, so some seats are going to just have almost no agency where even maxing the actually available missions isn’t enough, and that’s a miserable experience. When I play again, I’ll try to make sure that any mission that can’t be chased by everybody simultaneously “somehow” doesn’t make it onto the board. Fix those things for Canvas 2.0 and you’d have a real.. masterpiece.
Castles of Burgundy (3 plays, 2.0/4) The game play idea is neat. I mean, it has to be really good to get this rating given the other problems. The iconography is simply the worst I’ve ever seen. The buildings all look roughly the same and none of the differences have anything (that I can tell) to do with what they actually do. I’ve spent hours with the game and I’m still staring at them like “this wide one with one column over here, scan the player guide, ok it’s this one, that does that”. And the yellow tiles are even worse- basically 1/3 of the yellow tiles are functional on reading, 1/3 are incomprehensible without a rulebook, and 1/3 are useless without binoculars because they contain even smaller versions of the already indistinguishable buildings. If you have a PhD in Comparative Hieroglyphics and can effectively learn a full new alphabet on the fly, knock yourself out, but otherwise this game is going to be annoying as shit for a long time.
Deus (1 play 1.5/4) It’s an interesting system with a major randomness problem. You may not need a given action on a given turn, but if you go too long without the ability to do something, it’s crushing, and the most reliable mechanism to find a card costs an entire turn and itself requires a specific card type. There’s a full action/baby action system, but you can’t even take the baby action of the type you want without a card of the right type, and with a 5-card-hand/ 5-different-action framework, you’re missing what you need a fair bit. One of the good gamers and I were talking afterwards and decided that you should be able to play the wrong type of cards as blank buildings, and.. that turned out to be an optional once-per-game variant in the rulebook. I’m not sure that’s enough, but maybe it is. I’d much rather be fighting the other players than the game though. Baby actions at strength N-1 if you don’t have the right color maybe?
Khora (1 play, 1.0/4) Not bad, but it seemed pretty on-rails. You have an action you clearly want to do every turn. You draft as well as you can to maximize that and hope that nobody else is competing for your civilization type (e.g if you have two economy and 1 military player, the military player has free access and should have a big edge). Heaven help you if the randomness disagrees. The iconography here is also terrible. An owl is used for both money and tax. Only some tokens count for VP and they look the same as other tokens that don’t, that are gained the same way, except the scoring ones have a fancier design. I’d shit all over that even harder if I didn’t already shit on Burgundy and Everdell in the same update.
Enchanting Plumes (2 plays, 1.5/4 at 5 players, possibly better at fewer). It was actually more fun than that in the two plays, and the design is really cool, but the direction it was going was pretty clear and that game won’t be as much fun by play 5-10. Maybe it’s a significantly different game at 2 or 3 where each player has more control over the speed of deck churn, but at 5, it was pretty clear that the meta is YOLO play 2 with maybe one turn playing 1, mostly drawing 2, legal plays > card quality, and first-player advantage is huge since turn order is pretty likely to split who completes their peacock(s) and who doesn’t, and it takes a hell of a lot of card quality from playing slowly to make up for a big bonus and an extra 1-3 scoring cards. A very good 4+2 still usually loses to a 5 or 4+3, and anything smaller or less good just has to hope nobody else finishes. I’d want to play at a lower count to see how that seems to work out, and it may well be a significantly better game there since the design concept is pretty sweet. The suits are way too close in color/shape, but somehow this is SO bad- SOOOOOO bad that you should warn any new player and then warn them again once cards are dealt- that you don’t actually screw it up because you learn to be extra careful, and the visible card flow is low enough that you don’t have to process them fast.
Raccoon Tycoon (1 play 0.5/4) The pricing and selling part of the game is kind of cool, but everything else has the feel of something that was playtested by an extremely small group of people who aren’t very good at games. Many buildings are comically overpriced. One building type is essential (roughly +50% or more production), but only 4 are available in a 5-player game. You can house-rule that easily enough if you know to, but come ON. The endgame trigger had to be completely changed post-production. Several buildings and rules things are either unclear or clunky/counterintuitive. It’s a shame that a decent designer didn’t have this idea instead, because there probably could have been a good game here instead of just a good idea.
Run Fight or Die: Reloaded (1.5 plays, 0/4) Imagine playing a game of Yahtzee. Might be a little quaint for experienced gamers to bust it out in 2023 with with so many other options, but it’s still basically going to be fine. Now imagine playing Yahtzee with 5 players and it’s a race to 15 game wins. Yeah. “Basically fine” goes to complete torture when you overstay your welcome that much. There’s a little bit of a game here- probably less strategic depth than Yahtzee- but there’s nothing to do during downtime and the game drags on For Fucking Ever. If there were some way to speed it up, by, like, a lot (say the mutant zombie appears faster, is meaner, and killing it once ends the game), it might be a tolerable diversion, but as is, the correct choice from the title options is clearly Die to end the game (which I wound up doing on purpose when no other end was in sight).
Planet (2 plays, 0/4) The idea of using magnetic pieces to cover a globe is cool, but the magnets are too weak, and so is the game. It’s virtually impossible to tell what anybody else is doing, so you can chase things you were drawing dead at, goals are often literally 100% completely contradictory, and the randomly appearing objectives are almost half the points and hugely luck-dependent. Use dry-erase markers to color a balloon and save yourself the trouble of this mess.
The Palace of Mad King Ludwig (1 play, 0/4) If you took 4 cutthroat gamers and decided to commit to mastering this game, it would probably be ok eventually (although that’s a questionable life choice with so many fundamentally better games available). Played with random actions of having your stuff connected to/completed/hosed on a whim or through outright incompetence is just a brutal experience. Setup takes forever, the tiles are way too small for as many icons as they have, the scoring is beyond fiddly and requires tracking tons of counts of other player’s stuff, the gameplay isn’t that engaging to begin with, and it takes way too long. It sucks overall, but it’s not quite the no-redeeming-qualities utter dogshit tier most of the other 0.0s are even though you’d have to pay me a lot to ever play it again.
Ark Nova (many plays, 3.0/4) As much as I bitched about iconography all over this update, Ark Nova truly nailed it and did it without sacrificing cool artwork. Put symbols and text on a ~mono-colored background with good contrast and make them a readable size. You can do that and still have a shit game, but having readable/distinguishable game pieces and symbols is like the lowest-hanging fruit imaginable and so many games just seem to botch it hard for no apparent reason.
The game can also be frustrating, but far more often in the “What did I just do, I’m a total fucking moron” way than the game kicking you in the nuts with randomness, and because money and appeal snowball, if your opponent doesn’t blunder back quickly, the game can be clearly and hopelessly lost early, but you still have to sit around and wait to die. If you’re still new/terrible, you can learn things while you’re getting killed, and your opponent might somehow throw even a huge edge away, but once you’re both kind of decent, it’s pretty miserable to just be somebody’s hostage. And occasionally the game just deals out wildly imbalanced starts (hello Side Entrance) to where a medium-decent player like me can annihilate a great player pillar to post or where I can lose to a total trash can without making big mistakes and never feel like I’m in the game at any point. Some amount of randomness in this respect is fine. It’s just a bit too much here for a game of this length. And then you have the Eagle/Sun Bear issue where you think you might be winning, but you’re actually just beyond dead the whole time to their hidden resources and you’re annoyed at wasting the last 30 minutes of brainpower when you never had any chance (and not from the opponent slowrolling to be a dick- the endgame trigger condition rewards “still had all these”-style gameplay in many cases)
All of that said though, the game is really fun, playing a clean game is really rewarding, and most of the time it doesn’t shit on you. There’s tons of room for tight play, lots of different plans, lots of small-picture and big-picture puzzles to solve, and for a game with this many moving parts and so many different cards, it’s impressive that it fits together seamlessly and the egregious balance issues don’t pop up all that often. Definitely worth investing some time into if you want a heavy game.
I’ve been playing a weekly game session and we’ve tried out a bunch of games. Some good, some not so much. I’m generally a competitive, always trying to figure out how to win type of gamer, and generally prefer games with enough strategy and agency that players can realistically try to outplay each other, but there are a couple of games in here that aren’t very serious that I still enjoyed.
Rating system:
0-
Let it run until 1:12 for the full description. Actively unpleasant to play.
1- Replacement level- about equivalent to not playing and just doing a couple of Squardles on my phone instead. Thoroughly meh.
2- Has something going for it, but either not much depth or some flaws that keep me from rating it higher.
3- Solid depth, solid design, or a silly game that delivers exactly what you signed up for in a fun way.
4- Excellent. Plenty of depth, plenty of agency, plenty of replayability.
There’s also an implicit bonus for length not exceeding depth. Light games are much better if they don’t also take forever. Heavier games can get away with taking longer. Basically anything 2/4 or higher is a reasonable choice if you’re in the mood to play a game. These aren’t meant to be in-depth reviews of the games or anything, just my commentary- everything has a BGG link where you can read full reviews if the games are new to you.
Here to Slay (1 play, 0/4). Crab bucket effect, the game. One person tries to do something. Everybody else categorically always wants that to fail*, so they gang up to make sure it fails. Repeat ad infinitum. Except failing is quite punishing, so people mostly stop even trying to really accomplish things. On top of that, there are lots of heroes in play at any given time, they all roll dice, and some of them read like Questing Beast, so nobody really knows what’s going on and it takes forever. And the timing rules are effectively nonexistent (if you actually passed priority properly, it would take even more beyond forever) Nobody wanted to piss off the first-timer who brought the game by just saying “f this, we quit”, *but this game was so miserable to play that a table of mostly competitive gamers all defected to helping each other just to “legally” get the game over with. This fully earned the Beavis and Butt-head treatment.
Overboss (1 play, 1/4). I have the suspicion that this is closer to a 0.5, but it’s also possible that it’s not quite as bad as I think it is. The problem in my one playthrough is that some synergy strategies are highly rewarded when they hit, there’s not a whole lot of time to pivot, and hate-drafting has the usual multiplayer problem of significantly advantaging the players who aren’t involved, so what’s the counterplay? There’s also very limited foresight as to what could come out. Going for a build-around can either be an easy win or a complete disaster and there seems to be very little agency involved or non-suicidal intervention possible. Plus the gameplay didn’t really catch me- too many moving parts for not enough payoff. I’ll play this one more time just in case, but I don’t think it’s very good.
Crystallo (3 plays, 1.5/4) A basic strategy that seems highly favored to win seems pretty obvious. Winning while completing 4+ treasures (without memorizing the deck) seems hugely dependent on them coming out earlier than average or luckboxing hard later, so what do you do with the game after a couple of plays? I guess there’s trying to level up to god-tier mode where you know what all the treasures are and just play to create landing spots for them on your board (instead of prioritizing clearing gems) so as many as possible double-complete if they show up, but that’s more effort than I want to put into this game. Play somebody else’s copy when you’re waiting for something else to open. It’s fine for a couple of plays. It can also be played with more than one player, supposedly, but this seems like a terrible idea. If both players are about equal, it’s like playing only half the game in the same amount of time. If one player is better, watching the worse player make terrible moves would be exasperating.
Bunny Kingdom (1 play, 2/4). I absolutely ROFLstomped (240 points or something, more than double second place) the one game, so that probably added some fun to my experience. I don’t know if the other people simply had hopeless games or if they drafted/built badly and got about what they deserved. I mean I know I got somewhat lucky, but I could have been significantly less lucky and still won easily. It’s not bad and doesn’t take that long, but it also seems like Garfield never realized that he was thisclose to a different, better game. The game can almost be played effectively asynchronously (think store draft vs. timed PT draft), which is a huge plus, but the Camp mechanic, which sucks balls in its own right, also screws this up as well. Camp should have been the choice of a tunnel to an orthogonally adjacent square, giving you access to its resource types, or a bridge to give connectivity to two diagonally adjacent squares you already control. Then you’d have full asynchronicity and no nonsense of getting your bunnies randomly punted. That game would be a 2.5, maybe a 3 if it holds up better than I expect on replays, but alas. This could be worse than 2.0/4 if drafts really are beyond all hope with much regularity, but it would take more plays to know that.
Splendor (5 plays, 2.5/4) Splendor is a great game if nobody knows what’s up. I’m intentionally not spoiling what “what’s up” means, but you can find it easily enough if you want to find it. It’s a guaranteed savage beating if only one player knows what’s up. I have yet to play a game where more than 2/4 know what’s up, so it’s still basically 100% that one of those two will win and completely stomp the two who don’t. I’m curious what the game plays like if 3/4 or 4/4 people know what’s up. That could bump the rating half a point in either direction.
Azul: (many plays, 4/4). Easy 4/4. Play it, then play it some more. If your group is competitive/strategic at all, it’s a winner. 2-player is good as well. Just an all-time great game.
Jaipur (10 plays, 3/4). The game is both simple and really complicated. There are times I feel like I have no idea what I’m doing, but also times I can tell my opponents are doing things they shouldn’t have done even when they aren’t transparently boneheaded. The strategy hasn’t fully clicked to where I feel I have a base level of competence, but I want to keep playing and getting better at it. That’s a pretty good sign, right?
Endangered (1 play, 1/4). I don’t want to play a co-op janitor game (i.e. go around cleaning up the messes that appear) more than once in a blue moon and generally consider the genre below replacement. Not a full 0.0 for the competent entries, just been there, done that, not particularly fun. Endangered actually has a couple of things going for it. The dice allocation is interesting and the tiger movement/deforestation adds more agency than usual to the messes that appear. There’s also a full out random mess deck, because of course there has to be. I might have given this a 1.5, but it’s like they spent all the good idea points on the front half of the game and whiffed pretty hard on the back end. For a game called Endangered, you’d think you win by.. saving animals, but no. You win by convincing various UN ambassadors to vote for you. And they wanted to make a bunch of different ambassadors who have different subgoals, but they didn’t have enough ideas and started going for truly random stuff. Some of the ambassadors are influenced by doing well on the board (number of tigers, number of undeforested squares, etc) which is fine, but then there are meta ones that care about crap like cards in hand or just randomly rolling dice. if you love the genre, play it because this seems like an above-average entry, but if you’re not a huge fan, this isn’t going to change your mind.
Hues and Cues (4 plays, 3/4). This game is extremely silly. You keep score, but nobody really cares who wins. People can hop in and out of rounds and it doesn’t matter. This is the kind of game I shouldn’t even like, and definitely don’t have any great skill at, but somehow it’s just fun and everybody who plays it seems to have a good time. There’s even a little opportunity for guessing strategy if you’re looking for it, and I really want to bust out the obvious late/last-round dick move at some point just to see the reactions. For what it’s trying to do, it’s basically perfect IMO. Unless you have color blind people.
Cat in the Box(1 play, 3+/4) This game could easily wind up a 3.5 or 4 after a couple more plays. I’d be surprised if I drop it below 3 and shocked if I drop it below 2.5. I’d love to know how many psychedelics were consumed before coming up with “Selective trick-taking game where you try to hit your bid exactly to score your biggest orthogonally connected rank/suit area using a deck without suits”, but it seems to work really well. Not sure how it plays with 2 people, but with 4, it was great, and I think 3-5 would play well too. I can’t wait to play it again.
Black Fleet (1 play, 2.5/4). It was.. fine? The gameplay idea is neat, none of the random cards/abilities seemed absurdly overpowered (although some may be and we just didn’t run into the offending ones). I can’t recommend it as a must-have or anything, but it’s plenty entertaining and fairly short if somebody has a copy and wants to play.
Sagrada (2 plays, 1.0/4) The gameplay idea is kind of interesting, but the private objectives were wildly unbalanced both times and add a huge layer of luck on top of a game already full of dice. At least it doesn’t take that long. Plus if you’re playing a game in this space, why not just play Azul which is so much better in every way?
Black Hole Rainbows (1 play, 0/4). I guess there’s a target audience for these kinds of super-random screw-you free-for-alls, since I’ve seen a few of them around, but it’s so not me. They’re truly miserable, like New Reddit on desktop or using a porcupine as a loofah. The gameplay is garbage like Here to Slay, just not quite as bad, the cards aren’t as wordy, and the game is designed in a way that it (mercifully) inevitably trundles to completion before the heat death of the universe, but it’s still REALLY bad. And you have little idea from the box or the components (both quite nice) or the gameplay description that you’re getting this kind of absolute turd
Taco Cat Goat Cheese Pizza (1 play, 2/4). You get exactly what you sign up for, and it’s over pretty fast. The game would be completely unbearable with somebody who would argue or have an attitude about taking an L though, so be careful (thankfully, we didn’t have one).
San Juan (1 play, 1.5/4). I was actually really enjoying this game. It seemed to have interesting decisions, benefits for accurately predicting other players, etc., and it looked like I was clearly outplaying 2 of the players with the role timing and was a bit ahead of the third. And then people built their 6s at the very end and invalidated the rest of the game. I never saw a 6-card the entire game and didn’t even know that stuff existed until the end. I still tied for 2nd, but it seems extremely difficult to win without a 6 unless you completely outclass the other players, and if you don’t see a 6 early and they do, you either go all-in on a strategy and lose if you don’t find its 6 or stay open and hope you can recover from a few aimless turns because you don’t know what to chase yet. It’s hard to speak with much confidence after one play, and maybe the councillor role is generally good enough to dig for a 6 early most games (if you know you need to do it), but man. I was thinking this was like a 3.0/4 that played, very loosely speaking, with the interactivity of a 4-player version of Jaipur, and then the experience went to complete shit. I might decide it’s a 2/4 after a replay where I know what’s going on the whole time, but the randomness and strategic limitation of 6-drop reliance just kills any shot at being better than that, which is a shame.
Parks (1 play, 2+/4). I liked Parks. It’s like a cross between Splendor and Tokaido. I’m not sure if it’s 3.0 good or if it’s not interesting/varied enough on further plays to merit more than a 2.0. I definitely want to give it another play though.
Not even going to bother with a Betteridge’s Law headline here. On top of what at this point is presumptively bad-faith discussion of their own stats (rank-order correlations on team-switchers only? Really?) BP claimed that the Stuff+ metric has a team-switching problem and spent like 15 paragraphs discussing it. I’m only going to spend two paragraphs, because it just doesn’t.
Edit 5/5/2023: went ahead and got all the same players together with the exact same weighting for everything to make sure to compare DRA- to Stuff+ and other stats completely fairly and replaced the section with one composite chart.
Using data from Fangraphs and BP, I took each season 2020-2022 with at least 100 pitches thrown (this got rid of position players, etc.) and took DRA-, Pitches, Stuff+, FIP, xFIP-, SIERA, and ERA. Because each season’s ERA was quite different, I converted ERA/SIERA/FIP to Stat/MLB_Average_ERA for that season and multiplied by 100 to make a (non-park-adjusted) “Stat-“. DRA- and xFIP- are already on that scale. I then did an IP-weighted fit of same-season Stuff+ and “ERA-” and got predicted same-season “ERA-” = 98.93 – 1.15* (Stuff+ – 100). I then took paired consecutive player-seasons and compared weighted RMSEs for year T’s stats, broken down by team-switching status (No = both seasons for the same team, Yes = played for more than one team).
RMSE T+1 “ERA-“
Non-switch
Switch
All
Stuff+
38.0
37.4
37.7
“SIERA-“
39.5
38.9
39.26
DRA-
40.0
38.1
39.29
xFIP-
40.6
40.0
40.4
“FIP-“
43.4
49.2
45.6
“ERA-“
50.8
60.6
54.6
N
588
409
997
Literally no problems here. Stuff+ does fine with team-switchers, does better than park-unadjusted “FIP-” across the board, and does much better on team-switchers than park-unadjusted “FIP-“, as expected, since park-unadjusted FIP should be the metric taking a measurable accuracy hit from a park change. And yet somehow BP is reporting the complete opposite conclusions instead: 1) that Stuff+ is fine for non-switchers but becomes near-useless for team-switchers, and 2) that its performance degrades significantly compared to park-unadjusted-FIP for team switchers. Common sense and the data clearly say otherwise. DRA- grades out roughly between SIERA and xFIP- for non-switchers predicting next season’s ERA, on par with SIERA overall, and solidly behind Stuff+. (Apologies for temporarily stating it was much worse than that).
Looking at it another way, creating an IP-weighted-RMSE-minimizing linear fit for each metric to predict next season’s “ERA-” (e.g. Year T+1 ERA- = 99 + 0.1 * (year T DRA- – 100) gives the following chart
y=mx+b
intercept
slope
RMSE
r
Stuff+ ERA-
102.42
0.79
34.16
0.29
SIERA-
103.07
0.53
34.56
0.25
DRA-
101.42
0.49
34.62
0.24
xFIP-
101.57
0.40
34.88
0.21
“FIP-“
101.13
0.21
35.14
0.17
“ERA-“
100.87
0.11
35.40
0.12
everybody the same
100.55
0.00
35.65
0.00
The intercepts are different slightly out of noise and slightly because they’re not all centered exactly identically- SIERA has the lowest average value for whatever reason. ERA predicted from Stuff+ is the clear winner again, with DRA- again between SIERA and xFIP-. Since all the metrics being fit are on the same scale (Stuff+ was transformed into ERA- as in the paragraph above), the slopes can be compared directly, and the bigger the slope, the more one point of year-T stat predicts the year T+1 ERA-. Well, almost, since the slopes to year-T ERA aren’t exactly 1, but nothing is compressed enough to change rank order (DRA- almost catches SIERA, but falls further behind Stuff+) . One point of year-T Stuff+ ERA- is worth 1.00 points of Year T ERA- and 0.8 points of year T+1 ERA-. One point of year-T DRA- is worth 1.04 points of year-T ERA- but only 0.49 points of year-T+1 ERA-. Stuff+ is much stickier. Fitting to switchers only, the Stuff+ slope is 0.66 and DRA- is 0.46. Stuff+ is still much stickier. There’s just nothing here. Stuff+ doesn’t have a big team-switching problem and points of Stuff+ ERA- are clearly worth more than points of DRA- going forward for switchers and non-switchers alike.
TL;DR Using Sprint Speed, Reaction, and Burst from the Statcast leaderboard pages, with no catch information (or other information) of any kind, is enough to make a good description of same-season outfield OAA and that descriptive stat makes a better prediction of next-season outfield OAA than current-season OAA does.
A recently-released not-so-great defensive metric inspired me to repurpose an old idea of mine and see how well I could model outfield defense without knowing any actual play results, and the answer is actually pretty well. Making catches in the OF, taking positioning as a given as OAA does, is roughly based on five factors- reacting fast, accelerating fast, running fast, running to the right place, and catching the balls you’re close enough to reach.
Reacting fast has its own leaderboard metric (reaction distance, the distance traveled in the first 1.5s), as does running fast (Sprint Speed, although it’s calculated on offense). Acceleration has a metric somewhat covering it, although not as cleanly, in Burst (distance traveled between 1.5s and 3s). Running to the right place only has the route metric, which covers the first 3s only and is very confounded and doesn’t help nontrivially, so I don’t use it, and actually catching the balls is deliberately left out of the FID metric (I do provide a way to incorporate catch information into next season’s estimation at the end of each section).
2+ Star Plays
The first decision was what metric to try to model first, and I went with OAA/n on 2+ star plays over OAA/n for all plays for multiple reasons. 2+ star plays are responsible for the vast majority of seasonal OAA, OAA/n on 2+ star plays correlates at over r=0.94 to OAA/n on all plays (same season), so it contains the vast majority of the information in OAA/n anyway, and the three skills I’m trying to model based on aren’t put on full display on easier balls. Then I had to decide how to incorporate the three factors (Sprint Speed, Reaction, Burst). Reaction and Burst are already normalized to league-average, and I normalized sprint speed to the average OF speed weighted by the number of 2+ star opportunities they got (since that’s the average sprint speed of the 2+* sample). That can get janky early in a season before a representative sample has qualified for the leaderboard, so in that case it’s probably better to just use the previous season’s average sprint speed as a baseline for awhile as there’s not that much variation.
year
weighted avg OF Sprint Speed
2016
27.82
2017
27.93
2018
28.01
2019
27.93
2020
27.81
2021
27.94
2022
28.00
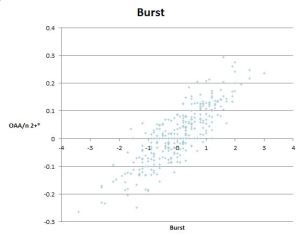
Conveniently each stat individually was pretty linear in its relationship to OAA/n 2+* (50+ 2* opportunities shown).
Reaction isn’t convincingly near-linear as opposed to some other positively-correlated shape, but it’s also NOT convincingly nonlinear at all, so we’ll just go with it.
The outlier at 4.7 reaction is Enrique Hernandez who seems to do this regularly but didn’t have enough opportunities in the other seasons to get on the graph again. I’m guessing he’s deliberately positioning “slightly wrong” and choosing to be in motion with the pitch instead of stationary-ish and reacting to it. If more players start doing that, then this basic model formulation will have a problem.
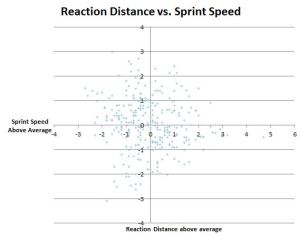
Reaction Distance and Sprint Speed are conveniently barely correlated, r=-.09, and changes from year to year are correlated at r=0.1. I’d expect the latter to be closer to the truth, given that for physical reasons there should be a bit of correlation, and there should be a bit of “missing lower left quadrant” bias in the first number where you can’t be bad at both and still get run out there, but it seems like the third factor to being put in the lineup (offense) is likely enough to keep that from being too extreme.
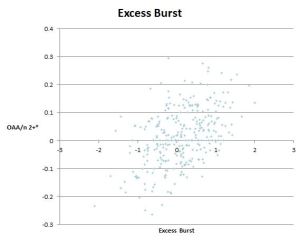
Burst, on the other hand, there’s no sugarcoating it. Correlation of r=0.4 to Reaction Distance (moving further = likely going faster at the 1.5s point, leading to more distance covered in the next 1.5s) and r=0.56 to Sprint Speed for obvious reasons. I took the easy way out with only one messy variable and made an Expected Burst from Reaction and Sprint Speed (r=0.7 to actual Burst), and then took the residual Burst – Expected Burst to create Excess Burst and used that as the third input. I also tried a version with Sprint Speed and Excess Bootup Distance (distance traveled in the correct direction in the first 3s) as a 2-variable model, and it still “works”, but it’s significantly worse in both description and prediction. Excess Burst also looks fine as far as being linear with respect to OAA/n.
Looking at how the inputs behave year to year (unless indicated otherwise, all correlations are with players who qualified for Jump stats to be calculated (10+ 2-star opportunities) and Sprint Speed leaderboard (10+ competitive runs) in both years, and correlations are weighted by year T 2+ star opportunities)
weighted correlation r-values (N=712)
itself next season
same-season OAA/n 2+*
next-season OAA/n 2+*
Sprint Speed above avg
0.91
0.49
0.45
Reaction
0.85
0.40
0.35
Burst
0.69
0.79
0.60
Excess Burst
0.53
0.41
0.21
Sprint Speed was already widely known to be highly reliable year-over-year, so no surprise there, and Reaction grades out almost as well, but Burst clearly doesn’t, particularly in the year-to-year drop in correlation to OAA/n. Given that the start of a run (Reaction) holds up year-to-year, and that the end of the run (Sprint Speed) holds up year-to-year, it’s very strange to me that the middle of the run wouldn’t. I could certainly believe a world where there’s less skill variation in the middle of the run, so the left column would be smaller, but that doesn’t explain the dropoff in correlation to OAA/n. Play-level data isn’t available, but what I think is happening here is that because Burst is calculated on ALL 2+* plays, it’s a mixture of maximum burst AND how often a player chose to use it, because players most definitely don’t bust ass for 3 seconds on plenty of the 2+* plays they don’t get close to making (and this isn’t even necessarily wrong on any given play, getting in position to field the bounce and throw can be the right decision)
I would expect maximum burst to hold up roughly as well as Reaction or Sprint Speed in the OAA/n correlations, but the choice component is the kind of noisy yes-no variable that takes longer to stabilize than a stat that’s closer to a physical attribute. While there’s almost no difference in Sprint Speed year-to-year correlation for players with 60+ attempts (n=203) and players with 30 or fewer attempts (n=265), r=0.92 to 0.90, there’s a huge dropoff in Burst, r=0.77 to r=0.57.
This choice variable is also a proxy for making catches- if you burst after a ball that some players don’t, you have a chance to make a catch that they won’t, and if you don’t burst after a ball that other players do, you have no chance to make a catch that they might. That probably also explains why the Burst metric and Excess Burst are relatively overcorrelated to same-season OAA/n.
Now that we’ve discussed the components, let’s introduce the Fielding-Independent Defense concept. It is a DESCRIPTIVE stat, the values of A/B/C/D in FID=(A + B* Reaction + C* Sprint Speed above average + D* Excess Burst) that minimizes SAME-SEASON opportunity-weighted RMSE between FID and OAA/n on whatever plays we’re looking at (here, 2+ star plays). Putting FID on the success probability added scale (e.g. if Statcast had an average catch probability of 50% on a player’s opportunities, and he caught 51%, he’s +1% success probability, and if FID expects him to catch 52%, he’d be +2% FID), I get
In an ideal world, the Y intercept (A) would be 0, because in a linear model, somebody who’s average at every component should be average, but our Sprint Speed above average here is above the weighted average of players who had enough opportunities to have stats calculated, which isn’t exactly the average including players who didn’t, so I let the intercept be free, and 0.1% on 2+ star plays is less than 0.1 OAA over a full season, so I’m not terribly worried at this point. And yeah, I know I’m nominally adding things that don’t even use the same units (ft vs. ft/s) and coming up with a number in outs/opportunity, so be careful porting this idea to different measurement systems because the coefficients would need to be converted from ft-1 etc.
So, how well does it do?
weighted correlation r-values (N=712)
itself next season
same-season OAA/n 2+*
next-season OAA/n 2+*
FID 2+*
0.748
0.806
0.633
OAA/n 2+*
0.591
1.000
0.591
OAA-FID
0.156
0.587
0.132
Regressed FID and (OAA-FID)
0.761
0.890
0.647
That’s pretty darn good for a purely descriptive stat that doesn’t know the outcome of any play, although 2+* plays do need physical skills more than 0-1* plays. The OAA-FID residual- actual catch information- does contain some predictive value, but it doesn’t help a ton. The regression amounts I came up with (the best fit regression for FID and OAA-FID together to predict next season’t OAA/n on 2+*) were 12 opportunities for FID and 218 opportunities for OAA-FID. Given that a full-time season is 70-80 2+ star opportunities on average (more for CF, fewer for corner), FID is half-real in a month and OAA-FID would be half-real if a season lasted 18 straight months. Those aren’t the usual split-sample correlations, since there isn’t any split-sample data available, but regressions based on players with different numbers of opportunities. That has its own potential issues, but 12 and 218 should be in the ballpark. FID stabilizes super-fast.
0 and 1 Star Plays
Since 0 and 1 star plays have a catch probability of at least 90%, there’s an upper bound on success probability added, and while players reaching +10% on 2+* plays isn’t rare, obviously that’s not going to translate over directly to a 105% catch rate on 0/1* plays. I did the same analysis for 0-1* plays as for 2+* plays using the 2+* metrics as well as a FID fit specifically for 0-1* plays. Everything here is weighted by the player’s number of 0-1* opportunities in year T.
weighted correlation r-values (N=712)
itself next season
same-season OAA/n 0/1*
next-season OAA/n 0/1*
FID 2+*
0.75
0.20
0.25
OAA/n 2+*
0.59
0.27
0.27
OAA-FID 2+*
0.15
0.18
0.11
FID reweighted for only 0/1*
0.75
0.22
0.26
OAA/n 0/1*
0.13
1.00
0.13
OAA-FID 0/1*
0.07
0.97
0.07
The obvious takeaway is that these correlations suck compared to the ones for 2+* plays, and that’s the result of there being a much larger spread in talent in the ability to catch 2+* balls compared to easier ones. 2* plays are ~25% of the total plays, but comprise ~80% of a player’s OAA. 0-1* plays are 3 times as numerous and comprise ~20% of OAA. OAA on 0-1* plays is just harder to predict because there’s less signal in it as seen by it self-correlating horrendously.
The other oddities are that OAA/n on 2+* outcorrelates FID from 2+* and that both FIDs do better on the next season than the current season. For the former, the residual OAA-FID on 2+* plays has a comparable signal, and 0-1* plays are a lot more weighted to “catch the ball” skill relative to physical skills than 2+* plays are, and OAA and especially the residual weight “catch the ball” heavily, so that’s my best guess for that. As to why FID correlates better to next season, I don’t have a great explanation there. It was odd enough that I recreated the entire analysis from scratch, but I just got the same thing again. I broke it down by year and didn’t see anything strange there either. 2020 correlated worse, of course, but everything is attempt-weighted so that shouldn’t much matter for same-season correlations.
Reaction time grades out relatively much less important in comparison to Sprint Speed and Burst for these plays than it did on 2+* plays, not shockingly.
All plays together
Doing the same analysis on all plays, and comparing the 2+* metrics to the all-play metrics, we get
weighted correlation r-values (N=712)
itself next season
same-season OAA/n all plays
next-season OAA/n all plays
FID 2+*
0.749
0.758
0.627
OAA/n 2+*
0.589
0.943
0.597
OAA-FID 2+*
0.154
0.559
0.153
FID Reweighted for all plays
0.751
0.759
0.628
OAA/n all plays
0.601
1.000
0.601
OAA-FID all plays
0.210
0.629
0.173
Regressed FID and (OAA-FID) 2+* only
0.760
0.842
0.642
Regressed FID and (OAA-FID) all plays
0.763
0.894
0.652
with regression numbers of 35 opportunities for all-play FID and 520 (~2 full seasons) opportunities for all-play OAA-FID. As a descriptive stat, you get basically everywhere you’re going to go with FID just by looking at 2* plays, and that’s also enough to outpredict last season’s OAA/n for all plays. The relative weights are fairly similar here- 1:1.34:1.57 Reaction:Sprint Speed:Excess Burst for all plays compared to 1:1.23:1.48 for only 2+* plays, with Reaction relatively a bit less important when considering all plays as expected given the 0-1* section. The equation for all plays is:
The coefficients are smaller than the 2+* version because there’s less variation in OAA/n than in 2+* plays, but to convert to a seasonal number, there are roughly 4 times as many total plays as 2+* plays, so it all works out. A hypothetical player who’s +1.0 in all components would be +16.3% on 2+star plays and +4.46% on all plays. Given a breakdown of 70 2+* attempts and 210 0/1* attempts for 280 total attempts in a season, this person would be expected to be +12.5 OAA overall, +11.4 OAA on 2+* plays and +1.1 OAA on 0/1* plays.
Defensive Aging
FID also allows a quick look at where aging comes from across the paired seasons. Sprint Speed is roughly a straight line down with age, and it’s the biggest driver of decline by far.
Reaction
Sprint Speed above avg
Excess Burst
Total
FID (all)
OAA.n (all)
Change
-0.0410
-0.1860
0.0133
-0.0030
-0.0029
Expected Impact (in catch %)
-0.046%
-0.279%
0.023%
-0.302%
-0.302%
-0.285%
That’s around a 0.9 drop in seasonal OAA on average from getting a year older that’s a very good match for the decline predicted by worse FID components. As a rough rule of thumb, 1 marginal foot in reaction distance is worth 3 OAA over a full year, 1 ft/s in Sprint Speed is worth 4 OAA, and 1 foot in Excess Burst is worth 5 OAA.
Conclusion
Sprint Speed, Reaction Distance, and Excess Burst really do cover most of the skill variation in defense, and by the time players have reached the major league level, their routes and ability to catch the ball are sufficiently good that those differences are overwhelmed by physical differences. This measure depends on that being true- at lower levels, it might not hold as well and the regression number for OAA-FID could drop much lower to where you’d be throwing away a lot of information by not considering OAA-FID. It’s also definitely vulnerable to Goodhart’s law- “When a measure becomes a target, it ceases to be a good measure“. It’s hard to uselessly game your FIP to be much lower than it would be if you were pitching normally, but without play-level data (or observation) to detect players in motion at the pitch, anybody who wanted to game FID could probably do it pretty easily.
TL;DR It massively cheats and it’s bad, just ignore it.
First, OAA finally lets us compare all outfielders to each other regardless of position and without need for a positional adjustment. Range Defense Added unsolves that problem and goes back to comparing position-by-position. It also produces some absolutely batshit numbers.
From 2022:
Name
Position
Innings
Range Out Score
Fielded Plays
Giancarlo Stanton
LF
32
-21.5
6
Giancarlo Stanton
RF
280.7
-6.8
90
Stanton was -2 OAA on the year in ~300 innings (like 1/4th of a season). An ROS of -21.5 over a full season is equivalent to pushing -50 OAA. The worst qualified season in the Statcast era is 2016 Matt Kemp (-26 OAA in 240 opportunities), and that isn’t even -*10*% success probability added (analogous to ROS), much less -21.5%. The worst seasons at 50+ attempts (~300 innings) are 2017 Trumbo and 2019 Jackson Frazier at -12%. Maybe 2022 Yadier Molina converted to a full-time CF could have pulled off -21.5%, but nobody who’s actually put in the outfield voluntarily for 300 innings in the Statcast era is anywhere near that terrible. That’s just not a number a sane model can put out without a hell of a reason, and 2022 Stanton was just bad in the field, not “craploads worse than end-stage Kemp and Trumbo” material.
Name
Position
Innings
Range Out Score
Fielded Plays
Luis Barrera
CF
1
6.1
2
Luis Barrera
LF
98.7
2
38
Luis Barrera
RF
101
4.6
37
I thought CF was supposed to be the harder position. No idea where that number comes from. Barrera has played OF quite well in his limited time, but not +6.1% over the average CF well.
As I did with the infield edition, I’ll be using rate stats (Range Out Score and OAA/inning) for correlations, each player-position-year combo is treated separately, and it’s important to repeat the reminder that BP will blatantly cheat to improve correlations without mentioning anything about what they’re doing in the announcements, and they’re almost certainly doing that again here.
Here’s a chart with year-to-year correlations broken down by inning tranches (weighted by the minimum of the two paired years)
LF
OAA to OAA
ROS to ROS
ROS to OAA
Lower innings
Higher Innings
Inn at other positions year T
Inn at other positions year T
n
0 to 10
-0.06
0.21
-0.11
6
102
246
267
129
10 to 25
-0.04
0.43
0.08
17
125
287
332
128
25 to 50
0.10
0.73
0.30
35
175
355
318
135
50 to 100
0.36
0.67
0.23
73
240
338
342
120
100 to 200
0.27
0.78
0.33
142
384
310
303
121
200 to 400
0.49
0.71
0.37
284
581
253
259
85
400+ inn
0.52
0.56
0.32
707
957
154
124
75
RF
OAA to OAA
ROS to ROS
ROS to OAA
Lower innings
Higher Innings
Inn at other positions year T
Inn at other positions year T
n
0 to 10
0.10
0.34
0.05
5
91
303
322
121
10 to 25
0.05
0.57
0.07
16
140
321
299
128
25 to 50
0.26
0.59
0.14
36
186
339
350
101
50 to 100
0.09
0.75
0.16
68
244
367
360
168
100 to 200
0.38
0.72
0.42
137
347
376
370
83
200 to 400
0.30
0.68
0.43
291
622
245
210
83
400+ inn
0.60
0.58
0.32
725
1026
120
129
92
CF
OAA to OAA
ROS to ROS
ROS to OAA
Lower innings
Higher Innings
Inn at other positions year T
Inn at other positions year T
n
0 to 10
0.00
0.16
0.09
5
161
337
391
83
10 to 25
0.00
0.42
-0.01
17
187
314
362
95
25 to 50
0.04
0.36
0.03
34
234
241
294
73
50 to 100
0.16
0.56
0.09
70
305
299
285
100
100 to 200
0.34
0.70
0.42
148
434
314
305
95
200 to 400
0.47
0.66
0.25
292
581
228
230
86
400+ inn
0.48
0.45
0.22
754
995
134
77
58
Focus on the left side of the chart first. OAA/inning behaves reasonably, being completely useless for very small numbers of innings and then doing fine for players who actually play a lot. ROS is simply insane. Outfielders in aggregate get an opportunity to make a catch every ~4 innings (where opportunity is a play that the best fielders would have a nonzero chance at, not something completely uncatchable that they happen to pick up after it’s hit the ground).
ROS is claiming meaningful correlations on 1-2 opportunities and after ~10 opportunities, it’s posting year to year correlations on par with OAA’s after a full season. That’s simply impossible (or beyond astronomically unlikely) to do with ~10 yes/no outcome data points with average talent variation well under +/-10%. The only way to do it is by using some kind of outside information to cheat (time spent at DH/1B?, who knows, who cares).
I don’t know why the 0-10 inning correlations are so low- those players played a fair bit at other positions (see the right side of the table), so any proxy cheat measures should have reasonably stabilized- but maybe the model is just generically batshit nonsense at extremely low opportunities at a position for some unknown reason as happened with the DRC+ rollout (look at the gigantic DRC+ spread on 1 PA 1 uBB pitchers in the cheating link above).
Also, once ROS crosses the 200-inning threshold, it starts getting actively worse at correlating to itself. Across all three positions, it correlates much better at lower innings totals and then shits the bed once it starts trying to correlate full-time seasons to full-time seasons. This is obviously completely backwards of how a metric should behave and more evidence that the basic model behavior here is “good correlation based on cheating (outside information) that’s diluted by mediocre correlation on actual play-outcome data.”
They actually do “improve” on team switchers here relative to nonswitchers- instead of being the worst as they were in the infield, again likely due to overfitting to a fairly small number of players- but it’s still nothing of note given how bad they are relative to OAA’s year-to year for regular players even with the cheating.
Baseball Prospectus came out with a new defensive metric in the vein of their DRC+ and DRA- stats. If you’re familiar with my commentary on DRC+, this is going to hit some of the same notes, but it’s still worth a quick read if you made it this far. The infield and outfield models for RDA behave extremely differently, so I’m going to discuss each one in a separate post. The outfield post is here.
The infield model is just simply bad compared to OAA/DRS. If somebody is giving you hype-job statistics and only tells you how well a team does against a non-division same-league opponent who’s at least 2 games below .500 while wearing uniforms with a secondary color hex code between #C39797 and #FFFFFF in Tuesday day games during a waxing gibbous moon.. well, that ought to make you immediately suspicious of how bad everything else is. And the same for the statistics cited in the RDA article.
That is.. the opposite of a resounding win for ROS/RDA. And it’s worse than it looks because OAA is (theoretically, and likely practically) the best at stripping out fielder positioning, while DRS and ROS will have some residual positioning information that will self-correlate to some extent. DRS also contains additional information (extra penalty for botched balls down the line, throwing errors, double plays) that likely help it self-correlate better, and ROS/RDA appear to contain outside information as described above which will also help it self-correlate better.
OAA/ inn
DRS/ inn
ROS
RDA/ inn
N
to OAA
0.44
0.32
0.22
0.21
177
to DRS
0.26
0.45
0.30
0.30
177
ROS/RDA correlating significantly better to DRS than to OAA is suggestive of a fair bit of its year-to-year self-correlation being to non-demonstrated-fielding-skill information.
Even in their supposed area of supremacy, team-switchers, infield ROS/RDA is still bad. Classifying players as either non-switchers (played both seasons for the same team only), offseason switchers (played all of year T for one team and all of year T+1 for a different team), or midseason switchers (switched teams in the middle of at least one season).
All IF
OAA/inn
DRS/inn
ROS
RDA/inn
n
Offseason
0.40
0.45
0.43
0.46
79
Midseason
0.39
0.31
0.13
0.11
91
Off or Mid
0.39
0.38
0.28
0.28
170
No Switch
0.45
0.45
0.37
0.36
541
All
0.44
0.45
0.36
0.35
711
They match OAA/DRS on offseason-switching players- likely due to overfitting their model to a small number of players- but they’re absolutely atrocious on midseason switchers, and they actually have the *biggest* overall drop in reliability between non-switchers and switchers. I don’t think there’s much more to say. Infield RDA/ROS isn’t better than OAA/DRS. It isn’t even close to equal to OAA/DRS.
Technical notes: I sourced OAA from Fangraphs because I didn’t see a convenient way to grab OAA by position from Savant without scraping individual player pages (the OAA Leaderboard .csv with a position filter doesn’t include everybody who played a position). This meant that the slightly inconvenient way of grabbing attempts from Savant wasn’t useful here because it also couldn’t split attempts by position, so I was left with innings as a denominator. Fangraphs doesn’t have a (convenient?) way to split defensive seasons between teams, while BP does split between teams on their leaderboard, so I had to combine split-team seasons and used a weighted average by innings. Innings by position match between BP and FG in 98.9% of cases and the differences are only a couple of innings here and there, nothing that should make much difference to anything.
This ties up a few loose ends with the Mythic ranking system and explains how the other behind the scenes MMRs work. As it turns out, there are five completely distinct rankings in Arena. Mythic Constructed, Mythic Limited, Serious Constructed, Serious Limited, and Play (these are my names for them).
Non-Mythic
All games played in ranked (including Mythic) affect the Serious ratings, *as do the corresponding competitive events- Traditional Draft, Historic Constructed Event, etc*. Serious ratings are conserved from month to month. Play rating includes the Play and Brawl queues, as well as Jump In (despite Jump In being a limited event), and is also conserved month to month. Nonsense events (e.g. the Momir and Artisan MWMs) don’t appear to be rated in any way.
The Serious and Play ratings appear to be intended to be a standard implementation of the Glicko-2 rating system except with ratings updated after every game. I say intended because they have a gigantic bug that screws everything up, but we’ll talk about that later. New accounts start with a rating of 1500, RD of 350, and volatility of 0.06. These update after every game and there doesn’t seem to be any kind of decay or RD increase over time (an account that hadn’t even logged in since before rotation still had a low RD). Bo1 and Bo3 match wins are rated the same for these.
Mythic
Only games played while in Mythic count towards the Mythic rankings, and the gist of the system is exactly as laid out in One last rating update although I have a slight formula update. These rankings appear to come into existence when Mythic is reached each month and disappear again at the end of the month (season).
I got the bright idea that they may be using the same code to calculate Mythic changes, and this appears to be true (I say appears because I have irreconcilable differences in the 5th decimal place for all of their Glicko-2 computations that I can’t resolve with any (tau, Glicko scale constant) pair. There’s either a small bug or some kind of rounding issue on one of our ends, but it’s really tiny regardless). The differences are that Mythic uses a fixed RD of 60 and a fixed volatility of 0.06 (or extremely extremely close) that doesn’t change after matches and that the rating changes are multiplied by 2 for Bo3 matches. Glicko with a fixed RD is very similar to Elo with a fixed K on matchups within 200 points of each other.
In addition, the initial Mythic rating is seeded *as a function of the Serious rating*. [Edit 8/1/2022: The formula is: if Serious Rating >=3000, Mythic Rating = 1650. Otherwise Mythic Rating = 1650 – ((3000 – Serious Rating) / 10). Using Serious Rating from before you win your play-in game to Mythic, not after you win it, because reasons] That’s the one piece I never exactly had a handle on. I knew that tanking my rating gave me easy pairings and a trash initial Mythic rating the next month, but I didn’t know how that happened. The existence of a separate conserved Serious rating explains it all. [Edit 8/1/22: rest of paragraph deleted since it’s no longer relevant with the formula given]
The Mythic system also had two fixed constants that previously appeared to be randomly arbitrary- the minimum win of 5.007 points and the +7.4 win/-13.02 loss when playing a non-Mythic. Using the Glicko formula with both players having RD 60 and Volatility 0.06, the first number appears when the rating difference is restricted to a maximum of exactly 200 points. Even if you’re 400 points above your opponent, the match is rated as though you’re only 200 points higher. The second number appears when you treat the non-Mythic player as rated exactly 100 points lower than you are (regardless of what your rating actually is) with the same RD=60. This conclusively settles the debate as to whether or not that system/those numbers were empirically derived or rectally derived.
The Huge Bug
As I reported on Twitter last month the Serious and Play ratings have a problem (but not Mythic.. at least not this problem). If you lose, you’re rated as though you lost to your opponent. If you win, you’re rated as though you beat a copy of yourself (rating and RD). And, of course, even though correcting the formula/function call is absolutely trivial, it still hasn’t been fixed after weeks. This bug dates to at least January, almost certainly to the back-end update last year, and quite possibly back into Beta.
Glicko-2 isn’t zero-sum by design (if two players with the same rating play, the one with higher RD will gain/lose more points), but it doesn’t rapidly go batshit. With this bug, games are now positive-sum in expectation. When the higher-rated player wins, points are created (the higher-rated player wins more points than they should). When the lower-rated player wins, points are destroyed (the lower-rated player wins fewer points than they should). Handwaving away some distributional things that the data show don’t matter, since the higher-rated player wins more often, points are created more than destroyed, and the entire system inflates over time.
My play rating is 5032 (and I’m not spending my life tryharding the play queue), and the median rating is supposed to be around 1500. In other words, if the system were functioning correctly, my rating would mean that I’d be expected to only lose to the median player 1 time per tens of millions of games. I’m going to go out on a limb and say that even if I were playing against total newbies with precons, I wouldn’t make it anywhere close to 10 million games before winding up on the business end of a Gigantosaurus. And I encountered a player in a constructed event who had a Serious Constructed rating over 9000, so I’m nowhere near the extreme here. It appears from several reports that the cap is exactly 10000.
In addition to inflating everybody who plays, it also lets players go infinite (up to 10000) on rating. Because beating a copy of yourself is worth ~half as many points as a loss to a player you’re expected to beat ~100% of the time, anybody who can win more than 2/3 of their matches will increase their rating without bound. Clearly some players (like the 9000 I played) have been doing this for awhile.
If the system were functioning properly, most people would be in a fairly narrow range. In Mythic constructed, something like 99% of players are between 1200-2100 (this is a guess, but I’m confident those endpoints aren’t too narrow by much, if at all), and that’s with a system that artificially spreads people out by letting high-rated players win too many points and low-rated players lose too many points. Serious Constructed would be spread out a bit more because it includes all the non-Mythics as well, but it’s not going to be that huge a gap down to the people who can at least make it out of Silver. And while the Play queue has much wider deck-strength, the deck-strength matching, while very far from perfect, should at least make the MMR difference more about play skill than deck strength, so it also wouldn’t spread out too far.
Instead, because of the rampant inflation, the center of the distribution is at like 4000 MMR instead of ~1500. Strong players are going infinite on the high side, and because new accounts still start at 1500, and there’s no way to make it to 4000 without winning lots of games (especially if you screwed around with precons or something for a few games at some point), there’s a constant trickle of relatively new (and some truly atrocious) accounts on the left tail spanning the thousands-of-points gap between new players and established players, and that gap only exists because of the rating bug. It looks something like this.
The three important features are that the bulk of the distribution is off by thousands of points from where it should be, noobs start thousands of points below the bulk, and players are spread over an absurdly wide range. The curves are obviously hand-drawn in Paint, so don’t read anything beyond that into the precise shapes.
This is why new players often make it to Mythic one time easily with functional-but-quite-underpowered decks- they make it before their Serious Constructed rating has crossed the giant gap from 1500 to the cluster where the established players reside. Then once they’ve crossed the gap, they mostly get destroyed. This is also why tanking the rating is so effective. It’s possible to tank thousands of points and get all the way back below the noob entry point. I’ve said repeatedly that my matchups after doing that were almost entirely obvious noobs and horrific decks, and now it’s clear why.
It shouldn’t be possible (without spending a metric shitton of time conceding matches, since there should be rapidly diminishing returns once you separate from the bulk) to tank far enough to do an entire Mythic climb with a high winrate without at least getting the rating back to the point where you’re bumping into the halfway competent players/decks on a regular basis, but because of the giant gap, it is. The Serious Constructed rating system wouldn’t be entirely fixed without the bug- MMR-based pairing still means a good player is going to face tougher matchups than a bad player on the way to Mythic, and tanking would still result in some very easy matches at the start- but those effects are greatly magnified because of the artificial gap that the bug has created.
What I still don’t know
I don’t know whether or not Serious or Mythic is used for pairing Mythic. I don’t have the data to know if Serious is used to pair ranked drafts or any other events (Traditional Draft, Standard Constructed Event, etc). It would take a 17lands-data-dump amount of match data to conclusively show that one way or another. AFAIK, WotC has said that it isn’t, but they’ve made incorrect statements about ratings and pairings before. And I certainly don’t know, in so, so many different respects, how everything made it to this point.
The TL;DR is that mudding adds moisture to the surface of the ball. Under normal conditions (i.e. stored with free airflow where it was stored before mudding), that moisture evaporates off in a few hours and leaves a good ball. If that evaporation is stopped, the ball goes to complete hell and becomes more slippery than a new ball. This is not fixed by time in free airflow afterwards.
My hypothesis is that the balls were sometimes getting stored in environments with sufficiently restricted airflow (the nylon ball bag) too soon after mudding, and that stopped the evaporation. This only became a problem this season with the change to mudding all balls on gameday and storing them in a zipped nylon bag before the game.
MLB released a new memo yesterday that attempts to standardize the mudding and storage procedure. Of the five bullet points, one (AFAIK) is not a change. Balls were already supposed to sit in the humidor for at least 14 days. Attempting to standardize the application procedure and providing a poster with allowable darkness/lightness levels are obviously good things. It may be relevant here if the only problem balls were the muddiest (aka wettest) which shouldn’t happen anymore, but from anecdotal reports, there were problem balls where players didn’t think the balls were even mudded at all, and unless they’re blind, that seems hard to reconcile with also being too dark/too heavily mudded. So this may help some balls, but probably not all of them.
Gameday Mudding
The other points are more interesting. Requiring all balls to be mudded within 3 hours of each other could be good or bad. If it eliminates stragglers getting mudded late, this is good. If it pushes all mudding closer to gametime, this is bad. Either way, unless MLB knows something I don’t (which is certainly possible- they’re a business worth billions and I’m one guy doing science in my kitchen), the whole gameday mudding thing makes *absolutely no sense* to me at all in any way.
Pre-mudding, all balls everywhere** are all equilibrated in the humidor the same way. Post-mudding, the surface is disrupted with transient excess moisture. If you want the balls restandardized for the game, then YOU MAKE SURE YOU GIVE THE BALL SURFACE TIME AFTER MUDDING TO REEQUILIBRATE TO A STANDARD ENVIRONMENT BEFORE DOING ANYTHING ELSE WITH THE BALL. And that takes hours.
In a world without universal humidors, gameday mudding might make sense since later storage could be widely divergent. Now, it’s exactly the same everywhere**. Unless MLB has evidence that a mudded ball sitting overnight in the humidor goes to hell (and I tested and found no evidence for that at all, but obviously my testing at home isn’t world-class- also, if it’s a problem, it should have shown up frequently in humidor parks before this season), I have no idea why you would mud on gameday instead of the day before like it was done last season. The evaporation time between mudding and going in the nylon bag for the game might not be long enough if mudding is done on gameday, but mudding the day before means it definitely is.
Ball Bag Changes
Cleaning the ball bag seems like it can’t hurt anything, but I’m also not sure it helps anything. I’m guessing that ball bag hygiene over all levels of the sport and prior seasons of MLB was generally pretty bad, yet somehow it was never a problem. They’ve seen the bottom of the bags though. I haven’t. If there’s something going on there, I’d expect it to be a symptom of something else and not a primary problem.
Limiting to 96 balls per bag is also kind of strange. If there is something real about the bottom of the bag effect, I’d expect it to be *the bottom of the bag effect*. As long as the number of balls is sufficient to require a tall stack in the bag (and 96 still is), and since compression at these number ranges doesn’t seem relevant (prior research post), I don’t have a physical model of what could be going on that would make much difference for being ball 120 of 120 vs. ball 96 of 96. Also, if the bottom of the bag effect really is a primary problem this year, why wasn’t it a problem in the past? Unless they’re using entirely new types of bags this season, which I haven’t seen mentioned, we should have seen it before. But I’m theorizing and they may have been testing, so treat that paragraph with an appropriate level of skepticism.
Also, since MLB uses more than 96 balls on average in a game, this means that balls will need to come from multiple batches. This seemed like it had the potential to be significantly bad (late-inning balls being stored in a different bag for much longer), but according to an AP report on the memo
“In an effort to reduce time in ball bags, balls are to be taken from the humidor 15-30 minutes before the scheduled start, and then no more than 96 balls at a time. When needed, up to 96 more balls may be taken from the humidor, and they should not be mixed in bags with balls from the earlier bunch.”
This seems generally like a step in the smart direction, like they’d identified being zipped up in the bag as a potential problem (or gotten the idea from reading my previous post from 30 days ago :)). I don’t know if it’s a sufficient mitigation because I don’t know exactly how long it takes for the balls to go to hell (60 minutes in near airtight made them complete garbage, so damage certainly appears in less time, but I don’t know how fast and can’t quickly test that). And again, repeating the mantra from before, time spent in the ball bag *is only an issue if the balls haven’t evaporated off after mudding*. And that problem is slam-dunk guaranteed solvable by mudding the day before, and then this whole section would be irrelevant.
Box Storage
The final point, “all balls should be placed back in the Rawlings boxes with dividers, and the boxes should then be placed in the humidor. In the past, balls were allowed to go directly into the humidor.” could be either extremely important or absolutely nothing. This doesn’t say whether the boxes should be open or closed (have the box top on) in the humidor. I tweeted to the ESPN writer and didn’t get an answer.
The boxes can be seen in the two images in https://www.mlb.com/news/rockies-humidor-stories. If they’re open (and not stacked or otherwise covered to restrict airflow), this is fine and at least as good as whatever was done before today. If the boxes are closed, it could be a real problem. Like the nylon ball bag, this is also a restricted-flow environment, and unlike the nylon ball bag, some balls will *definitely* get in the box before they’ve had time to evaporate off (since they go in shortly after mudding)
I have one Rawlings box without all the dividers. The box isn’t airtight, but it’s hugely restricted airflow. I put 3 moistened balls in the box along with a hygrometer and the RH increased 5% and the balls lost moisture about half as fast as they did in free air. The box itself absorbed no relevant amount. With 6 moistened balls in the box, the RH increased 7% (the maximum moistened balls in a confined space will do per prior research) and they lost moisture between 1/3 and 1/4 as fast as in free air.
Unlike the experiments in the previous post where the balls were literally sealed, there is still some moisture flux off the surface here. I don’t know if it’s enough to stop the balls from going to hell. It would take me weeks to get unmudded equilibrated balls to actually do mudding test runs in a closed box, and I only found out about this change yesterday with everybody else. Even if the flux is still sufficient to avoid the balls going to hell directly, the evaporation time appears to be lengthened significantly, and that means that balls are more likely to make it into the closed nylon bag before they’ve evaporated off, which could also cause problems at that point (if there’s still enough time for problems there- see previous section).
The 3 and 6 ball experiments are one run each, in my ball box, which may have a better or worse seal than the average Rawlings box, and the dividers may matter (although they don’t seem to absorb very much moisture from the air, prior post), etc. Error bars are fairly wide on the relative rates of evaporation, but hygrometer don’t lie. There doesn’t seem to be any way a closed box isn’t measurably restricting airflow and increasing humidity inside unless the box design changed a lot in the last 3 years. Maybe that humidity increase/restricted airflow isn’t enough to matter directly or indirectly, but it’s a complete negative freeroll. Nothing good can come of it. Bad things might. If there are reports somewhere this week that tons of balls were garbage, closed-box storage after mudding is the likely culprit. Or the instructions will actually be uncovered open box (and obeyed) and the last 5 paragraphs will be completely irrelevant. That would be good.
Conclusion: A few of the changes are obviously common-sense good. Gameday mudding continues to make no sense to me and looks like it’s just asking for trouble. Box storage in the humidor after mudding, if the boxes are closed, may be introducing a new problem. It’s unclear to me if the new ball-bag procedures reduce time sufficiently to prevent restricted-airflow problems from arising there, although it’s at least clearly a considered attempt to mitigate a potential problem.