One last rating update

Summary of everything I know about the constructed rating system first. (Edit 6/16/22: Mythic Limited appears to be exactly the same) Details of newly-discovered things below that.

  1. Bo1 K in closely matched Mythic-Mythic matches is 20.37.   The “K” for Mythic vs. non-Mythic matches is 20.41, and 20.52 for capped Mythic vs. Mythic matches (see #2).  These are definitely three different numbers.  Go figure.
  2. The minimum MMR change for a Bo1 win/loss is +/-5 and the maximum change is +/-15.5
  3. All Bo3 K values/minimum changes are exactly double the Bo1 K values.
  4. Every number is in the uncanny valley of being very close to a nice round number but not actually being a nice round number (e.g. the 13 below is 13.018).
  5. Every match between a Mythic and a Diamond/Plat (and probably true for Gold and lower as well) is rated *exactly the same way* regardless of either the Mythic’s MMR or the non-Mythic’s MMR. In Bo1 +7.4 points for a win and ~13 points for a loss (double for Bo3)
  6. As of November 2021, all draws are +/- 0 MMR
  7. Glicko-ness isn’t detectable at Mythic.  The precalculated/capped rating changes don’t vary at all based on number of games played, and controlled “competitive” Mythic matches run at exactly the same K at different times/on different accounts.
  8. Mythic vs. Mythic matches are zero-sum
  9. MMR doesn’t drift over time
  10. MMR when entering Mythic is pretty rangebound regardless of how high or low it “should” be.  It’s capped on the low end at what I think is 1400 (~78%) and capped on the high end at 1650 (~92%).  Pre-December, this range was 1485-1650.  January #1500 MMR was 1782.
  11. Having an atrocious Mythic MMR in one month gets you easier matchmaking the next month and influences where you rank into Mythic. [Edit: via the Serious Rating, read more here]
  12. Conceding during sideboarding in a Bo3 rates the game at its current match score with the Bo1 K value. (concede up 1-0, it’s like you won a Bo1 EVEN THOUGH YOU CONCEDED THE MATCH.  Concede 1-1 and it’s a 0-change draw.  Concede down 0-1 and lose half the rating points).  This is absolutely batshit insane behavior. (edit: finally fixed as of 3/17/2022)
  13. There are other implementation issues.  If WotC is going to ever take organized play seriously again with Arena as a part, or if Arena ever wants to take itself seriously at all, somebody should talk to me.

MMR for Mythic vs. Non-Mythic

Every match between a Mythic and a Diamond/Plat (and probably Gold and lower as well) was rated *exactly the same way* regardless of either the Mythic’s MMR or the non-Mythic’s MMR. In Bo1 +7.4 points for a win, ~13 points for a loss, and -5.6 points for a draw**(??!??!).  Bo3 values were exactly double that for win/loss.

That’s not something I was expecting to see.  Mythic MMR is not a separate thing that’s preserved in any meaningful way between months, so I have no idea what’s going on underneath the hood that led to that being the choice of implementations.  The draw value was obviously bugged- it’s *exactly* double the loss it should be, so somebody evidently used W+L instead of (W+L)/2.  **The 11/11/2021 update, instead of fixing the root cause of the instant-draw bug, instead changed all draws to +/-0 MMR and fixed the -5.6 point bug by accident.

That led to me slightly overestimating Bo3 K before- I got paired against more Diamonds in Bo3 than Bo1 and lost more points- and to my general confusion about how early-season MMR worked.  It now looks like it’s the exact same system the whole month, just with more matches against non-Mythics thrown in early on and rated strangely.

Ranking into Mythic

Edit: Read this

Before it got changed in December, everybody ranked into Mythic between 1650 and 1485 MMR, and it took concerted effort to be anywhere near the bottom of that range.  That’s roughly, most months, an MMR that would finish at ~83-93% if no more games were played, and in reality for anybody playing normally 88-93%.  The end-of-month #1500 MMR that I’ve observed was in the 1800s before November, ~1797 in November, ~1770 in December, and ~1780 in January.  So no matter how well you do pre-Mythic, you have work to do (in effect, grinding up from 92-93%) to finish top-1500.

In December, the floor got reduced to what appears to be ~1400, although the exact value is unattainable because you have to end on a winning streak to get out of Diamond.  An account with atrocious MMR in the previous month that also conceded a metric shitton of games at Diamond 4 ranked in at ~1410 under the new system.  The ceiling is still 1650.  These lower initial Mythic MMRs are almost certainly a big part of the end-of-season #1500 MMR dropping by 20-30 points.

Season Reset

Edit: Read this, section is obsolete now.

MMR is preserved, at least to some degree, and there isn’t a clearly separate Mythic and non-Mythic MMR.  I’d done some work to quantify this, but then things changed in December, and I’m unlikely to repeat it.  What has changed is that previous-season Mythic MMR seems to have a bigger impact now.  I had an account with a trash MMR in January make Mythic in February without losing a single game (finally!), and it still only ranked in at 1481.  It would have been near or above 1600 under the old system, and now it’s ranking in below the previous system’s floor.

I hope everybody enjoyed this iteration, and if you’re chasing #1 Mythic this month or in the future, it’s not me.  Or if it is me, I won’t be #1 and above 1650.

A comprehensive list of non-algorithmic pairings in RLCS 2021-22 Fall Split

Don’t read this post by accident.  It’s just a data dump.

This is a list of every Swiss scoregroup in RLCS 2021-22 Fall Split that doesn’t follow the “highest seed vs lowest possible seed without rematches” pairing algorithm.

I’ll grade every round as correct, WTFBBQ (the basic “rank teams, highest-lowest” would have worked, but we got something else, or we got literally impossible pairing like two teams who started 1-0 playing in R3 mid, or the pairings are otherwise utter nonsense), pairwise swap fail (e.g if 1 has played 8, swapping to 1-7 and 2-8 would work, but we got something worse), and complicated fails for things that aren’t resolved with one or more independent pairwise swaps.

Everything is hand-checked through Liquipedia.

There’s one common pairwise error that keeps popping up, with 6 teams and the #2 and #5 (referred to as 7-10 and 10-13 error a few times) have played.  Instead of leaving the 1-6 matchup alone and going to 2-4 and 3-5, they mess with the 1-6 and do 1-5, 2-6, 3-4.  The higher seed has priority for being left alone, and EU, which uses a sheet and made no mistakes all split, handled this correctly in both Regional 2 Closed R5 and Regional 3 Closed R4 Low.  EU is right.  The 7-10 and 10-13 errors below are actual mistakes.

SAM Fall Split Scoregroup Pairing Mistakes:

Invitational Qualifier

https://liquipedia.net/rocketleague/Rocket_League_Championship_Series/2021-22/Fall/South_America/1/Invitational_Qualifier

Round 2 High, FUR should be playing the worst 3-2 (TIME), but is playing Ins instead. WTFBBQ

Round 2 Low, NBL (highest 2-3) should be playing the worst 0-3 (FNG), but isn’t. WTFBBQ

Round 3 Low, Seeding is (W, L, GD, initial seed, followed by opponents each round if relevant)
13 lvi     0 2 -3 3
14 vprs 0 2 -4 12
15 neo  0 2 -4 15
16 fng   0 2 -5 16

but pairings were LVI-NEO and VPRS-FNG. WTFBBQ

Round 4 high:

Seedings were (1 and 2 are the 3-0s that have qualified, not a bug, the order is correct- LOC is 2 (4) because it started 2-0)
3 ts 2 1 4 5 vprs time fur
4 loc 2 1 1 14 lvi tts era
5 nbl 2 1 4 4 time vprs ins
6 tts 2 1 2 11 elv loc kru
7 elv 2 1 1 6 tts lvi nva
8 time 2 1 0 13 nbl ts dre

TS and time can’t play again, but 3-7 and 4-8 (and 5-6) is fine. Pairwise Swap fail.

Round 4 Low:

9 nva 1 2 -1 7 kru era elv
10 dre 1 2 -1 9 ins fng time
11 ins 1 2 -4 8 dre fur nbl
12 kru 1 2 -4 10 nva neo tts
13 lvi 1 2 -2 3 loc elv neo
14 vprs 1 2 -3 12 ts nbl fng

All base pairings worked, but we got ins-lvi somehow. WTFBBQ

Round 5:
Seedings were:
ts 2 2 1 5 vprs time fur elv
time 2 2 -2 13 nbl ts dre tts
loc 2 2 -2 14 lvi tts era nbl
lvi 2 2 -1 3 loc elv neo ins
vprs 2 2 -1 12 ts nbl fng nva
kru 2 2 -2 10 nva neo tts dre

Loc-LVI is the only problem, but the pairwise swap to time-lvi and loc-vprs works fine. Instead we got ts-lvi. Pairwise swap fail (being generous).

4 WTFBBQ, 2 pairwise swap fails, 6 total.

———————————————–

SAM regional 1 Closed Qualifier

https://liquipedia.net/rocketleague/Rocket_League_Championship_Series/2021-22/Fall/South_America/1/Closed_Qualifier

Round 2 High has Kru-NEO and Round 2 Low has AC-QSHW which are both obviously wrong. WTFBBQ x2

Round 3 High

1 ts 2 0 6 1
2 ins 2 0 5 6
3 dre 2 0 4 4
4 neo 2 0 4 7

And we got ts-dre and neo-ins WTFBBQ

R3 Mid
5 nva 1 1 2 5 emt7 dre
6 loc 1 1 1 3 naiz ins
7 kru 1 1 -1 2 qshw neo
8 fng 1 1 -2 8 lgc ts
9 lgc 1 1 2 9 fng prds
10 ac 1 1 2 10 neo qshw
11 bnd 1 1 0 11 ins naiz
12 emt7 1 1 0 12 nva nice

5-12 and 8-9 are problems, but the two pairwise swaps (11 for 12 and 10 for 9) work. Instead we got nva-bnd and then loc-ac for no apparent reason. Pairwise swap fail.

Round 3 Low:
qshw 0 2 -5 15
nice 0 2 -6 13
naiz 0 2 -6 14
prds 0 2 -6 16

and we got qshw-naiz. WTFBBQ.

R4 High:
dre 2 1 1 4 nice nva ts
neo 2 1 1 7 ac kru ins
nva 2 1 5 5 emt7 dre bnd
ac 2 1 3 10 neo qshw loc
kru 2 1 0 2 qshw neo lgc
fng 2 1 -1 8 lgc ts emt7

neo is the problem, having played ac and kru. Dre-fng can be paired without a forced rematch, which is what the algorithm says to do, and we didn’t get it. Complicated fail

R4 Low
9 lgc 1 2 1 9 fng prds kru
10 loc 1 2 0 3 naiz ins ac
11 emt7 1 2 -1 12 nva nice fng
12 bnd 1 2 -3 11 ins naiz nva
13 naiz 1 2 -4 14 loc bnd qshw
14 prds 1 2 -5 16 ts lgc nice

9-14 and 10-13 are rematches, but the pairwise swap solves it. Instead we got EMT7-PRDS. Pairwise swap fail.

R5:
6 neo 2 2 0 7 ac kru ins fng
7 ac 2 2 0 10 neo qshw loc nva
8 kru 2 2 -2 2 qshw neo lgc dre
9 lgc 2 2 4 9 fng prds kru naiz
10 loc 2 2 3 3 naiz ins ac prds
11 emt7 2 2 2 12 nva nice fng bnd

7-10 and 8-9 are the problem, but instead of pairwise swapping, we got neo-lgc. Really should be a WTFBBQ, but a pairwise fail.

+4 WTFBBQ (8), +3 Pairwise (5), +1 complicated (1), 14 total.

————————————————-

SAM Regional 1

https://liquipedia.net/rocketleague/Rocket_League_Championship_Series/2021-22/Fall/South_America/1

R4 Low

9 vprs 1 2 -1 7 drc emt7 ts
10 dre 1 2 -2 12 elv lvi nva
11 fng 1 2 -2 13 tts ftw drc
12 end 1 2 -3 8 ts loc tts
13 elv 1 2 -2 5 dre nva emt7
14 loc 1 2 -3 15 fur end ftw

10-13 is the only problem, but instead of 10-12 and 11-13, they fucked with vprs pairing. Pairwise swap fail.

+0 WTFBBQ(8), +1 pairwise swap (6), +0 complicated (1), 15 total.

——————————————————————

SAM Regional 2 Closed Qualifier

https://liquipedia.net/rocketleague/Rocket_League_Championship_Series/2021-22/Fall/South_America/2/Closed_Qualifier

Round 2 Low:

FDOM (0) vs END (-1) is obviously wrong. WTFBBQ. And LOLOLOL one more time at zero-game-differential forfeits.

R3 Mid:
5 fng 1 1 2 4 nice loc
6 ftw 1 1 2 7 flip vprs
7 drc 1 1 -1 3 kru elv
8 fdom 1 1 -1 9 emt7 nva
9 kru 1 1 1 14 drc ac
10 sac 1 1 0 16 vprs flip
11 end 1 1 -1 11 loc emt7
12 ball 1 1 -1 15 nva nice

The base pairings work, but we got FNG-end and ftw-ball for some reason. WTFBBQ. Even scoring the forfeit 0-3 doesn’t fix this.

R3 Low:
emt7 0 2 0 8
flip 0 2 -5 10
nice 0 2 -5 13
ac 0 2 -6 12

and we got emt-flip. WTFBBQ.

R4 High:

3 vprs 2 1 2 1 sac ftw nva
4 loc 2 1 -1 6 end fng elv
5 ftw 2 1 4 7 flip vprs ball
6 drc 2 1 2 3 kru elv sac
7 fdom 2 1 1 9 emt7 nva kru
8 end 2 1 1 11 loc emt7 fng

Base pairings worked. WTFBBQ

R4 Low:
9 fng 1 2 0 4 nice loc end
10 kru 1 2 -1 14 drc ac fdom
11 ball 1 2 -3 15 nva nice ftw
12 sac 1 2 -3 16 vprs flip drc
13 ac 1 2 -3 12 elv kru nice
14 flip 1 2 -5 10 ftw sac emt7

fng, the top seed, doesn’t play either of the teams that were 0-2.. base pairings would have worked. WTFBBQ.

+5 WTFBBQ (13), +0 pairwise fail (6), +0 complicated (1), 20 total.


Sam Regional 3 Closed

https://liquipedia.net/rocketleague/Rocket_League_Championship_Series/2021-22/Fall/South_America/3/Closed_Qualifier

R4 High

3 endgame 2 1 5 1 bnd tn vprs
4 lev 2 1 4 5 sac endless elv
5 bnd 2 1 1 16 endgame benz ball
6 fng 2 1 0 6 ball resi endless
7 fdom 2 1 -1 10 ftw elv emt7
8 tn 2 1 -2 2 benz endgame ftw

end-tn doesn’t work, but the pairwise swap is fine, and instead we got end-fng!??! Pairwise fail.

R4 low:

9 emt7 1 2 0 9 endless sac fdom
10 ftw 1 2 -1 7 fdom ag tn
11 ball 1 2 -2 11 fng vprs bnd
12 endless 1 2 -3 8 emt7 lev fng
13 ag 1 2 -2 14 elv ftw benz
14 sac 1 2 -4 12 lev emt7 resi

9-14 and 10-13 are problems, but the pairwise swap is fine.  Instead we got emt7-ftw which is stunningly wrong.  Pairwise fail.

Round 5:

6 fng 2 2 -2 6 ball resi endless endgame
7 bnd 2 2 -2 16 endgame benz ball lev
8 tn 2 2 -3 2 benz endgame ftw fdom
9 ftw 2 2 1 7 fdom ag tn emt7
10 endless 2 2 0 8 emt7 lev fng ag
11 ball 2 2 -1 11 fng vprs bnd sac

This is a mess, going to the 8th most preferable pairing before finding no rematches, and.. they got it right.  After screwing up both simple R4s.

Final SAM mispaired scoregroup count: +5 WTFBBQ (13), +2 pairwise fail (8), +0 complicated (1), 22 total.

OCE Fall Scoregroup pairing mistakes


Regional 1 Invitational Qualifier

https://liquipedia.net/rocketleague/Rocket_League_Championship_Series/2021-22/Fall/Oceania/1/Invitational_Qualifier

Round 2 Low:

The only 2-3, JOE, is paired against the *highest* seeded 0-3 instead of the lowest.  WTFBBQ.

R3 Mid:

5 kid 1 1 0 6 rrr riot
6 grog 1 1 0 9 joe gz
7 bndt 1 1 0 10 vc rng
8 dire 1 1 -1 3 eros wc
9 eros 1 1 0 14 dire pg
10 vc 1 1 -1 7 bndt gse
11 rrr 1 1 -2 11 kid joe
12 tri 1 1 -2 15 rng rru


8-9 and 7-10 are problems, but a pairwise swap fixes it, and instead every single pairing got fucked up.  Pairwise fail is too nice, but ok.

R4 Low:

9 eros 1 2 -2 14 dire pg kid
10 vc 1 2 -3 7 bndt gse dire
11 tri 1 2 -3 15 rng rru grog
12 rrr 1 2 -4 11 kid joe bndt
13 joe 1 2 1 8 grog rrr pg
14 gse 1 2 -3 13 wc vc rru

Base pairings work.  WTFBBQ

2 WTFBBQ, 1 pairwise, 3 total.

OCE Regional 1 Closed Qualifier

https://liquipedia.net/rocketleague/Rocket_League_Championship_Series/2021-22/Fall/Oceania/1/Closed_Qualifier

Round 2 Low:

The best 2-3 (1620) is paired against the best 0-3 (tri), not the worst (bgea).  WTFBBQ.

Round 4 High:

3 gse 2 1 1 1 tisi joe hms
4 grog 2 1 0 3 smsh bott wc
5 eros 2 1 4 5 hms rust bott
6 waz 2 1 4 11 tri hms pg
7 T1620 2 1 2 10 rru tri joe
8 rru 2 1 1 7 T1620 wc tisi


Base pairings work.  WTFBBQ.

Round 5:

6 T1620 2 2 1 10 rru tri joe gse
7 waz 2 2 1 11 tri hms pg eros
8 grog 2 2 -1 3 smsh bott wc rru
9 tisi 2 2 2 16 gse bgea rru bott
10 tri 2 2 -1 6 waz T1620 bgea joe
11 rust 2 2 -2 13 joe eros smsh pg

7-10 is the problem, but they swapped with 6-11 instead of leaving 6-11 and swapping with 7-10.  Pairwise fail.

+2 WTFBBQ(4), +1 pairwise(2), 6 total.

OCE Regional 1

https://liquipedia.net/rocketleague/Rocket_League_Championship_Series/2021-22/Fall/Oceania/1

Round 5:

6 riot 2 2 3 2 grog rust eros bndt
7 grog 2 2 0 15 riot gz blss rrr
8 wc 2 2 -1 9 kid bndt rng dire
9 fbrd 2 2 2 13 bndt kid T1620 hms
10 blss 2 2 1 6 eros T1620 grog gse
11 kid 2 2 -2 8 wc fbrd dire eros

Exact same mistake as above. Pairwise fail.

+0 WTFBBQ(4), +1 pairwise(3), 7 total.

OCE Regional 2 Closed

Round 3 Mid:

5 blss 1 1 0 2 tri fbrd
6 pg 1 1 0 14 gse t1620
7 tisi 1 1 -1 11 rust eros
8 ctrl 1 1 -1 13 hms waz
9 gse 1 1 0 3 pg lits
10 grog 1 1 0 12 eros rust
11 bott 1 1 0 16 fbrd tri
12 hms 1 1 -1 4 ctrl bstn


Base pairings work.  WTFBBQ

Round 4 Low:

9 blss 1 2 -1 2 tri fbrd bott
10 gse 1 2 -1 3 pg lits tisi
11 pg 1 2 -1 14 gse t1620 hms
12 ctrl 1 2 -2 13 hms waz grog
13 tri 1 2 -2 15 blss bott bstn
14 lits 1 2 -4 10 t1620 gse rust


Base pairings work.  WTFBBQ

+2 WTFBBQ(6), +0 pairwise(3), 9 total.

OCE Regional 3 Closed

https://liquipedia.net/rocketleague/Rocket_League_Championship_Series/2021-22/Fall/Oceania/3/Closed_Qualifier

R3 Mid:

5 gse 1 1 2 7 lits t1620
6 wc 1 1 0 1 tisi grog
7 deft 1 1 0 6 zbb eros
8 gue 1 1 0 15 bott crwn
9 tri 1 1 1 12 grog tisi
10 bott 1 1 0 2 gue pg
11 lits 1 1 -1 10 gse ctrl
12 corn 1 1 -2 13 eros zbb

Base pairings work.  WTFBBQ

R3 Low

13 zbb 0 2 -3 11 deft corn
14 ctrl 0 2 -5 8 t1620 lits
15 pg 0 2 -5 14 crwn bott
16 tisi 0 2 -5 16 wc tri

Base Pairings work.  WTFBBQ

R4 High:

3 crwn 2 1 4 3 pg gue t1620
4 grog 2 1 1 5 tri wc eros
5 wc 2 1 3 1 tisi grog bott
6 tri 2 1 2 12 grog tisi deft
7 gue 2 1 2 15 bott crwn lits
8 corn 2 1 0 13 eros zbb gse

Base pairings work.  WTFBBQ

R4 Low:

9 gse 1 2 0 7 lits t1620 corn
10 deft 1 2 -1 6 zbb eros tri
11 bott 1 2 -3 2 gue pg wc
12 lits 1 2 -3 10 gse ctrl gue
13 zbb 1 2 0 11 deft corn ctrl
14 tisi 1 2 -3 16 wc tri pg

10-13 is the problem, pairwise swapped with 9-14 instead of 11-12.  Pairwise fail.

+3 WTFBBQ(9), +1 pairwise(4), 13 total.

OCE Regional 3:

https://liquipedia.net/rocketleague/Rocket_League_Championship_Series/2021-22/Fall/Oceania/3

R3 Low:

13 tri 0 2 -3 14 riot wc
14 gue 0 2 -5 15 gz t1620
15 crwn 0 2 -6 11 kid grog
16 tisi 0 2 -6 16 rng eros

Base pairings work. WTFBBQ

OCE Final count: +1 WTFBBQ(10), +0 pairwise(4), 14 total.

SSA Scoregroup Pairing Mistakes

Regional 1

https://liquipedia.net/rocketleague/Rocket_League_Championship_Series/2021-22/Fall/Sub-Saharan_Africa/1

Round 2 Low:

The 0 GD FFs are paired against the best teams instead of the worst.  WTFBBQ.


SSA Regional 2 Closed

https://liquipedia.net/rocketleague/Rocket_League_Championship_Series/2021-22/Fall/Sub-Saharan_Africa/2/Closed_Qualifier

Round 4 Low:

9 bw 1 2 -3 6 crim est slim
10 aces 1 2 -3 12 llg biju info
11 crim 1 2 -5 11 bw dd fsn
12 win 1 2 -5 16 mist gst auf
13 biju 1 2 -2 13 info aces est
14 slap 1 2 -6 14 auf fsn gst

10-13 pairwise exchanging with 9-14 instead of 11-12.  Pairwise fail.

SSA Regional 2

https://liquipedia.net/rocketleague/Rocket_League_Championship_Series/2021-22/Fall/Sub-Saharan_Africa/2

R4 High

3 atk 2 1 4 2 mils ag bvd
4 org 2 1 1 3 dwym atmc op
5 atmc 2 1 4 7 mist org oor
6 llg 2 1 4 12 oor bvd dd
7 auf 2 1 3 9 ag mils exo
8 ag 2 1 0 8 auf atk mist

3-8 is the problem, but instead of pairwise swapping with 4-7, the pairing is 3-4?!?!?!

R4 Low

9 mist 1 2 0 10 atmc dwym ag
10 dd 1 2 -3 11 exo fsn llg
11 oor 1 2 -4 5 llg info atmc
12 exo 1 2 -5 6 dd op auf
13 fsn 1 2 -1 16 op dd dwym
14 info 1 2 -2 13 bvd oor mils

Another 10-13 pairwise mistake.


SSA Regional 3 Closed

https://liquipedia.net/rocketleague/Rocket_League_Championship_Series/2021-22/Fall/Sub-Saharan_Africa/3/Closed_Qualifier

Round 5

6 fsn 2 2 -1 5 slim lft gst blc
7 mils 2 2 -1 6 blc chk ddogs oor
8 roc 2 2 -1 10 gst mlg slim mist
9 ddogs 2 2 3 4 alfa mist mils lft
10 gst 2 2 0 7 roc oor fsn alfa
11 slim 2 2 0 12 fsn llg roc est


This is kind of a mess, but 6-9, 7-8, 10-11 is correct, and instead they went with 6-7, 8-9, 10-11!??!? which is not.  Complicated fail.


SSA total (1 event pending): 1 WTFBBQ, 3 pairwise, 1 complicated.

APAC N Swiss Scoregroup pairing mistakes

Regional 2

https://liquipedia.net/rocketleague/Rocket_League_Championship_Series/2021-22/Fall/Asia-Pacific_North/2

Round 5:

6 xfs 2 2 1 8 nor gds nov dtn
7 alh 2 2 0 10 n55 timi gra hill
8 cv 2 2 -1 4 chi gra gds n55
9 gra 2 2 -1 6 blt cv alh nor
10 chi 2 2 -2 13 cv blt dtn nov
11 timi 2 2 -2 16 ve alh blt wiz

This is a mess, but a pairing is possible with 6-11, so it must be done.  Instead they screwed up that match and left 7-10 alone.  Complicated fail

APAC S Swiss Scoregroup pairing mistakes

Regional 2 Closed

https://liquipedia.net/rocketleague/Rocket_League_Championship_Series/2021-22/Fall/Asia-Pacific_South/2/Closed_Qualifier

Round 4 Low:

9 exd 1 2 1 14 flu dd shg
10 vite 1 2 -2 12 shg cel flu
11 wide 1 2 -3 10 pow che ete
12 pow 1 2 -4 7 wide hira acrm
13 whe 1 2 -4 9 ete acrm che
14 sjk 1 2 -4 16 cel shg axi

11-12 is the problem, and instead of swapping to 10-12 11-13, they swapped to 10-11 and 12-13.  Pairwise fail.


Round 5

6 acrm 2 2 1 13 pc whe pow ete
7 flu 2 2 -2 3 exd axi vite dd
8 shg 2 2 -3 5 vite sjk exd hira
9 exd 2 2 4 14 flu dd shg sjk
10 pow 2 2 -1 7 wide hira acrm whe
11 wide 2 2 -3 10 pow che ete vite

another 8-9 issue screwing with 6-11 for no reason.  Complicated fail.

Regional 3 Closed:

https://liquipedia.net/rocketleague/Rocket_League_Championship_Series/2021-22/Fall/Asia-Pacific_South/3/Closed_Qualifier

Round 3 Mid

Two teams from the 1-0 bracket are playing each other (and two from the 0-1 playing each other as well obviously).  I checked this one on Smash too.  WTFBBQ

Round 4 High

3 dd 2 1 2 2 wc woa bro
4 flu 2 1 2 4 soy fre pum
5 znt 2 1 5 1 woa wc shg
6 pc 2 1 4 3 lads pum woa
7 ete 2 1 3 7 wash bro wide
8 fre 2 1 2 12 shg flu exd

The default pairings work.  WTFBBQ

Round 4 Low

9 exd 1 2 -1 6 pum lads fre
10 wide 1 2 -1 8 bro wash ete
11 woa 1 2 -3 16 znt dd pc
12 shg 1 2 -4 5 fre soy znt
13 soy 1 2 -2 13 flu shg wc
14 lads 1 2 -2 14 pc exd wash

9-14 is the problem, and the simple swap with 10-13 works.  Instead they did 9-12, 10-11 , 13-14.  Pairwise fail.


Round 5:

6 ete 2 2 2 7 wash bro wide dd
7 fre 2 2 0 12 shg flu exd znt
8 flu 2 2 -1 4 soy fre pum pc
9 soy 2 2 0 13 flu shg wc lads
10 woa 2 2 0 16 znt dd pc wide
11 shg 2 2 -3 5 fre soy znt exd

8-9 is the problem, but the simple swap with 7-10 works.  Instead we got 6-8, 7-9, 10-11.  Pairwise fail.

APAC Total: 2 WTFBBQ, 3 Pairwise fails, and 1 complicated.

NA Swiss Scoring Pairing Mistakes

Regional 3 Closed

https://liquipedia.net/rocketleague/Rocket_League_Championship_Series/2021-22/Fall/North_America/3/Closed_Qualifier

Round 4

3 pk 2 1 4 11 rbg yo vib
4 gg 2 1 1 1 exe sq oxg
5 eu 2 1 4 14 sq exe rge
6 sq 2 1 1 3 eu gg tor
7 xlr8 2 1 1 12 vib leh sr
8 yo 2 1 1 15 tor pk clt

This is a mess.  3-8 is illegal, but 3-7 can lead to a legal pairing, so it must be done (3-7, 4-5, 6-8). Instead we got 3-6, 4-8, 5-7.  Complicated fail.

EU made no mistakes.  Liquipedia looks sketchy enough on MENA that I don’t want to try to figure out who was what seed when.

Final tally across all regions

WTFBBQ Pairwise Complicated Total
SAM 13 8 1 22
OCE 10 4 0 14
SSA 1 3 1 5
APAC 2 3 1 6
NA 0 0 1 1
EU 0 0 0 0
Total 26 18 4 48

Missing the forest for.. the forest

The paper  A Random Forest approach to identify metrics that best predict match outcome and player ranking in the esport Rocket League got published yesterday (9/29/2021), and for a Cliff’s Notes version, it did two things:  1) Looked at 1-game statistics to predict that game’s winner and/or goal differential, and 2) Looked at 1-game statistics across several rank (MMR/ELO) stratifications to attempt to classify players into the correct rank based on those stats.  The overarching theme of the paper was to identify specific areas that players could focus their training on to improve results.

For part 1, that largely involves finding “winner things” and “loser things” and the implicit assumption that choosing to do more winner things and fewer loser things will increase performance.  That runs into the giant “correlation isn’t causation” issue.  While the specific Rocket League details aren’t important, this kind of analysis will identify second-half QB kneeldowns as a huge winner move and having an empty net with a minute left in an NHL game as a huge loser move.  Treating these as strategic directives- having your QB kneel more or refusing to pull your goalie ever- would be actively terrible and harm your chances of winning.

Those examples are so obviously ridiculous that nobody would ever take them seriously, but when the metrics don’t capture losing endgames as precisely, they can be even *more* dangerous, telling a story that’s incorrect for the same fundamental reason, but one that’s plausible enough to be believed.  A common example is outrushing your opponent in the NFL being correlated to winning.  We’ve seen Derrick Henry or Marshawn Lynch completely dump truck opposing defenses, and when somebody talks about outrushing leading to wins, it’s easy to think of instances like that and agree.  In reality, leading teams run more and trailing teams run less, and the “signal” is much, much more from capturing leading/trailing behavior than from Marshawn going full beast mode sometimes.

If you don’t apply subject-matter knowledge to your data exploration, you’ll effectively ask bad questions that get answered by “what a losing game looks like” and not “what (actionable) choices led to losing”.  That’s all well-known, if worth restating occasionally.

The more interesting part begins with the second objective.  While the particular skills don’t matter, trust me that the difference in car control between top players and Diamond-ranked players is on the order of watching Simone Biles do a floor routine and watching me trip over my cat.  Both involve tumbling, and that’s about where the similarity ends.

The paper identifies various mechanics and identifies rank pretty well based on those.  What’s interesting is that while they can use those mechanics to tell a Diamond from a Bronze, when they tried to use those mechanics to predict the outcome of a game, they all graded out as basically worthless.  While some may have suffered from adverse selection (something you do less when you’re winning), they had a pretty good selection of mechanics and they ALL sucked at predicting the winner.  And, yet, beyond absolutely any doubt, the higher rank stratifications are much better at them than the lower-rank ones.  WTF? How can that be?

The answer is in a sample constructed in a particularly pathological way, and it’s one that will be common among esports data sets for the foreseeable future.  All of the matches are contested between players of approximately equal overall skill.  The sample contains no games of Diamonds stomping Bronzes or getting crushed by Grand Champs.

The players in each match have different abilities at each of the mechanics, but the overall package always grades out similarly given that they have close enough MMR to get paired up.  So if Player A is significantly stronger than player B at mechanic A to the point you’d expect it to show up, ceteris paribus, as a large winrate effect, A almost tautologically has to be worse at the other aspects, otherwise A would be significantly higher-rated than B and the pairing algorithm would have excluded that match from the sample.  So the analysis comes to the conclusion that being better at mechanic A doesn’t predict winning a game.  If the sample contained comparable numbers of cross-rank matches, all of the important mechanics would obviously be huge predictors of game winner/loser.

The sample being pathologically constructed led to the profoundly incorrect conclusion

Taken together, higher rank players show better control over the movement of their car and are able to play a greater proportion of their matches at high speed.  However, within rank-matched matches, this does not predict match outcome.Therefore, our findings suggest that while focussing on game speed and car movement may not provide immediate benefit to the outcome within matches, these PIs are important to develop as they may facilitate one’s improvement in overall expertise over time.

even though adding or subtracting a particular ability from a player would matter *immediately*.  The idea that you can work on mechanics to improve overall expertise (AKA achieving a significantly higher MMR) WITHOUT IT MANIFESTING IN MATCH RESULTS, WHICH IS WHERE MMR COMES FROM, is.. interesting.  It’s trying to take two obviously true statements (Higher-ranked players play faster and with more control- quantified in the paper. Playing faster and with more control makes you better- self-evident to anybody who knows RL at all) and shoehorn a finding between them that obviously doesn’t comport.

This kind of mistake will occur over and over and over when data sets comprised of narrow-band matchmaking are analysed that way.

(It’s basically the same mistake as thinking that velocity doesn’t matter for mediocre MLB pitchers- it doesn’t correlate to a lower ERA among that group, but any individuals gaining velocity will improve ERA on average)


Monster Exploit(s) Available In M:tG Arena MMR

Edit: FINALLY fixed as of 3/17/2022 (both conceding during sideboarding and losing match due to roping out, and presumably to the chess clock running out as well)

Not just the “concede a lot for easy pairings” idea detailed in Inside the MTG: Arena Rating System, which still works quite well, as another Ivana 49-1 cakewalk from Plat 4 to Mythic the past couple of days would attest, but this time exploits that can be used for the top-1200 race itself.

In Bo3, conceding on the sideboarding screen ends the match *and only considers previous games when rating the match*.  Conceding down 0-1 makes you lose half-K instead of full-K (Bo1 K-value is ~1/2 Bo3 K-value).  If the matchup is bad, you can use this to cut your losses.  Conceding at 1-1 treats the match as a (half-K) draw- literally adding a draw to your logfile stats as well as rating the match as a draw.  If game 3 is bad for you, you can lock in a draw this way instead of playing it.

If you win game 1 and concede, it gets rated as a half-K match WIN (despite showing a Defeat screen).  This means that you can always force a match to play exactly as Bo1 if you want to- half K, 1 game, win or lose- so you don’t have to worry about post-sideboard games, can safely play glass-cannon strategies that get crushed by a lot of decks post-board, etc.- and you still have the option to play on if you like the Game 2 matchup.

Draws from the draw bug (failure to connect, match instantly ending in a draw) are also rated as a draw.  I believe that’s a new bug from the big update (edit: apparently not, unless it got patched and unpatched since February- see the comment below).  It’s rated as a normal draw in Bo1 and a half-K draw in Bo3.


Inside the MTG: Arena Rating System

Edit: A summary, including some updates, is now at https://hareeb.com/2022/02/02/one-last-rating-update/

Note: If you’re playing in numbered Mythic Constructed during the rest of May, and/or you’d like to help me crowdsource enough logfiles to get a full picture of the Rank # – Rating relationship during the last week, please visit https://twitter.com/Hareeb_alSaq/status/1397022404363395079 and DM/share.  If I get enough data, I can make a rank-decay curve for every rank at once, among other things.

Brought to you by the all-time undisputed king of the percent gamers

Apologies for the writing- Some parts I’d written before, some I’m just writing now, but there’s a ton to get out, a couple of necessary experiments weren’t performed or finished yet, and I’m sure I’ll find things I could have explained more clearly.  The details are also seriously nerdy, so reading all of this definitely isn’t for everybody.  Or maybe anybody.

TL;DR

  1. There is rating-based pairing in ranked constructed below Mythic (as well as in Mythic).
  2. It’s just as exploitable as you should think it is
  3. There is no detectable Glicko-ness to Mythic constructed ratings in the second half of the month. It’s indistinguishable from base-Elo
    1. Expected win% is constrained to a ~25%-~75% range, regardless of rating difference, for both Bo1 and Bo3.  That comes out to around 11% Mythic later in the month.
    2. After convergence, the Bo1 K-value is ~20.5.  Bo3 K is ~45.
    3. The minimum change in rating is ~5 points in a Bo1 match and ~10 points in a Bo3 match.
  4. Early in the month, the system is more complicated.
  5. Performance before Mythic seems to have only slight impact on where you’re initially placed in Mythic.
  6. Giving everybody similar initial ratings when they make Mythic leads to issues at the end of the month.
  7. The change making Gold +2 per win/-1 per loss likely turbocharged the issues from #6

It’s well known that the rank decay near the end of the month in Mythic Constructed is incredibly severe.  These days, a top-600 rating with 24 hours left is insufficient to finish top-1200, and it’s not just a last-day effect.  There’s significant decay in the days leading up to the last day, just not at that level of crazy.  The canonical explanations were that people were grinding to mythic at the end of the month and that people were playing more in the last couple of days.  While both true, neither seemed sufficient to me to explain that level of decay.  Were clones of the top-600 all sitting around waiting until the last day to make Mythic and kick everybody else out?  If they were already Mythic and top-1200 talent level, why weren’t they mostly already rated as such?  The decay is also much, much worse than it was in late 2019, and those explanations give no real hint as to why.

The only two pieces of information we have been given are that 1) Mythic Percentile is the percentage (Int(Your Rating/#1500 rating)) of the actual internal rating of the #1500 player.  This is true. 2) Arena uses a modified Glicko system.  Glicko is a modification of the old Elo system.  This is, at best, highly misleading.  The actual system does multiple things that are not Glicko and does not do at least one thing that is in Glicko.

I suspected that WotC might be rigging the rating algorithm as the month progressed, either deliberately increasing variance by raising the K-value of matches or by making each match positive-sum instead of zero-sum (i.e. calculating the correct rating changes, then giving one or both players a small boost to reward playing).  Either of these would explain the massive collision of people outside the top-1200, who are playing, into the the people inside the top-1200 who are trying to camp on their rating.  As it turns out, neither of those appear to be directly true.  The rating system seems to be effectively the same throughout the last couple of weeks of the month, at least in Mythic.  The explanations for what’s actually going on are more technical, and the next couple of sections are going to be a bit dry.  Scroll down- way down- to the Problems section if you want to skip how I wasted too much of my time.

I’ve decided to structure this as a journal-of-my-exploration style post, so it’s clear why it was necessary to do what I was doing if I wanted to get the information that WotC has continually failed to provide for years.

Experiments:

Background

I hoped that the minimum win/loss would be quantized at a useful level once the rating difference got big enough, and if true, it would allow me to probe the algorithm.  Thankfully, this guess turned out to be correct.  Deranking to absurdly low levels let me run several experiments.

Under the assumption that the #1500 rating does not change wildly over a few hours in the middle of the month when there are well over 1500 players, it’s possible to benchmark a rating without seeing it directly.  For instance, a minimum value loss that knocks you from 33% to 32% at time T will leave you with a similar rating, within one minimum loss value, as a 33%-32% loss several hours later.  Also, if nothing else is going on, like a baseline drift, the rating value of 0 is equivalent over any timescale within the same season.  This sort of benchmarking was used throughout.

Relative win-loss values

Because at very low rating, every win would be a maximum value win and every loss would be a minimum value loss, the ratio I needed to maintain the same percentile would let me calculate the win% used to quantize the minimum loss.  As it turned out, it was very close to 3 losses for every 1 win, or a 25%-75% cap, no matter how big the rating difference (at Mythic).  This was true for both Bo1 and Bo3, although I didn’t measure Bo3 super-precisely because it’s a royal pain in the ass to win a lot of Bo3s compared to spamming Mono-R in Bo1 on my phone, but I’m not far off whatever it is.  My return benchmark was reached at 13 wins and 39 losses, which is 3:1, and I assumed it would be a nice round number. Unfortunately, as I discovered later, it was not *exactly* 3:1, or everybody’s life would have been much easier.

Relative Bo1-Bo3 K values

Bo3 has about 2.2 times the K value of Bo1.  By measuring how many min-loss matches I had to concede in each mode to drop the same percentage, it was clear that the Bo3 K-value was a little over double the Bo1 K-value.  In a separate experiment, losing 2-0 or 2-1 in Bo3 made no difference (as expected, but no reason not to test it).  Furthermore, being lower rated and having lost the last match (or N matches) had no effect on the coin toss in Bo3.  Again, it shouldn’t have, but that was an easy test.

Elo value of a percentage point

This is not a constant value throughout the month because the rating of the #1500 player increases through the month, but it’s possible to get an approximate snapshot value of it.  Measuring this, the first way I did it, was much more difficult because it required playing matches inside the 25%-75% range, and that comes with a repeated source of error.  If you go 1-1 against players with mirrored percentile differences, those matches appear to offset, except because the ratings are only reported as integers, it’s possible that you went 1-1 against players who were on average 0.7% below you (meaning that 1-1 is below expectation) or vice versa. The SD of the noise term from offsetting matches would keep growing and my benchmark would be less and less accurate the more that happened.

I avoided that by conceding every match that was plausibly in the 25-75% range and only playing to beat much higher rated players (or much lower rated, but I never got one, if one even existed).  Max-value wins have no error term, so the unavoidable aggregate uncertainty was kept as small as possible.  Using the standard Elo formula value of 400 (who knows what it is internally, but Elo is scale-invariant), the 25%-75% cap is reached at a 191-point difference, and by solving for how many points/% returned my variable-value losses to the benchmark where I started, I got a value of 17.3 pts/% on 2/16 for Bo1.

I did a similar experiment for Bo3 to see if the 25%-75% threshold kicked in at the same rating difference (basically if Bo3 used a number bigger than 400).  Gathering data was much more time-consuming this way, and I couldn’t measure with nearly the same precision, but I got enough data to where I could exclude much higher values.  It’s quite unlikely that the value could have been above 550, and it was exactly consistent with 400, and it’s unlikely that they would have bothered to make a change smaller than that, so the Bo3 value is presumably just 400 as well.

This came out to a difference of around 11% mythic being the 25-75% cap for Bo1 and Bo3, and combined with earlier deranking experiments, a K-value likely between 20-24 for Bo1 and 40-48 for Bo3.  Similar experiments on 2/24 gave similar numbers.  I thought I’d solved the puzzle in February.  Despite having the cutoffs incorrect, I still came pretty close to the right answer here.

Initial Mythic Rating/Rating-based pairing

My main account made Mythic on 3/1 with a 65-70% winrate in Diamond.  I made two burners for March, played them normally through Plat, and then diverged in Diamond.  Burner #1 played through diamond normally (42-22 in diamond, 65-9 before that).  Burner #2 conceded hundreds of matches at diamond 4 before trying to win, then went something like 27-3 playing against almost none of the same decks-almost entirely against labors of jank love, upgraded precons, and total nonsense.  The two burners made Mythic within minutes of each other.  Burner #1 started at 90%.  Burner #2 started at 86%.  My main account was 89% at that point (I’d accidentally played and lost one match in ranked because the dogshit client reverted preferences during an update and stuck me in ranked instead of the play queue when I was trying to get my 4 daily wins).  I have no idea what the Mythic seeding algorithm is, but there was minimal difference between solid performance and intentionally being as bad as possible.

It’s also difficult to overstate the difference in opponent difficulty that rating-based pairing presents.  A trash rating carries over from month to month, so being a horrendous Mythic means you get easy matches after the reset, and conceding a lot of matches at any level gives you an easy path to Mythic (conceding in Gold 4 still gets you easy matches in Diamond, etc)

Lack of Glicko-ness

In Glicko, rating deviation (a higher rating deviation leads to a higher “K-value”) is supposed to decrease with number of games played and increase with inactivity.  My main account and the two burners from above should have produced different behavior.  The main account had craploads of games played lifetime, a near-minimum to reach Mythic in the current season, and had been idle in ranked for over 3 weeks with the exception of that 1 mistake game.  Burner #1 had played a near-minimum number of games to reach Mythic (season and lifetime) and was currently active.  Burner #2 had played hundreds more games (like 3x as many as Burner #1) and was also currently active.

My plan was to concede bunches of matches on each account and see how much curvature there was in the graph of Mythic % vs. expected points lost (using the 25-75 cap and the 11% approximation) and how different it was between accounts.  Glicko-ness would manifest as a bigger drop in Mythic % earlier for the same number of expected points lost because the rating deviation would be higher early in the conceding session.  As it turned out, all three accounts  just produced straight lines with the same slope (~2.38%/K on 3/25).  Games played before Mythic didn’t matter.  Games played in Mythic didn’t matter.  Inactivity didn’t matter.  No Glicko-ness detected.

Lack of (explicit) inactivity penalty

I deranked two accounts to utterly absurd levels and benchmarked them at a 2:1 percentage ratio.  They stayed in 2:1 lockstep throughout the month (changes reflecting the increase in the #1500 rating, as expected). I also sat an account just above 0 (within 5 points), and it stayed there for like 2 weeks, and then I lost a game and it dropped below 0, meaning it hadn’t moved any meaningful amount.  Not playing appears to do absolutely nothing to rating during the month, and there doesn’t seem to be any kind of baseline drift.

At this point (late March), I believed that the system was probably just Elo (because the Glicko features I should have detected were clearly absent), and that the win:loss ratio was exactly 3:1, because why would it be so close to a round number without being a round number.  Assuming that, I’d come up with a way to measure the actual K-value to high precision.

Measuring K-Value more precisely

Given that the system literally never tells you your rating, it may sound impossible to determine a K-value directly, but assuming that we’re on the familiar 400-point scale that Arpad Elo published that’s in common usage (and that competitive MTG used to use when they had such a thing), it actually is, albeit barely.

Assume you control the #1500-rated player and the #1501 player, and that #1501 is rated much lower than #1500.  #1501 will be displayed as a percentile instead of a ranking.  If you call the first percentile displayed you see 1501-A, then lose a (minimum value) match with the #1500 player, you’ll get a new percentile displayed, 1501B.  Call the #1500’s initial rating X, and the #1501’s rating Y.  This gives a solvable system of equations.

Y/X = 1501A  and Y/(X-1 min loss) = 1501B.

This gives X and Y in terms of min-losses (e.g. X went from (+5.3 minlosses to +4.3 minlosses).

Because 1501A and 1501B are reported as integers, the only way to get that number reported to a useful precision is for Y to be very large in magnitude and X to be very small.  And of course getting Y large in magnitude means losing a crapload of matches.  Getting X to be very small was accomplished via the log files.  The game doesn’t tell you your mythic percentile when you’re top-1500, but the logfile stores your percentage of the lowest-rated Mythic.  So the lowest-rated Mythic is 100% in the logfile, but once the lowest-rated Mythic goes negative from losing a lot of matches, every normal Mythic will report a negative percentile.  By conceding until the exact match where the percentile flips from -1.0 to 0, that puts the account with a rating within 1 minloss of 0.  So you have a very big number divided by a very small number, and you get good precision.

Doing a similar thing controlling the #1499, #1500, and #1501 allows benchmarking all 3 accounts in terms of minloss, and then playing the 1499-1500 against each other creates a match where you know the initial rating and the final rating of each participant (as a multiple of minloss), and then, along with knowing that the win:loss ratio is 3:1, making K=4*minloss plugging into the Elo formula gives

RatingChange*minloss= 4*minloss/(1+ 10^(InitialRatingDifference*minloss/400))

and you can solve for minloss, and then for K.  As long as nobody randomly makes Mythic right when you’re trying to measure, which would screw everything up and make you wait another month to try again…  It also meant that I’d have multiple accounts whose rating in terms of minloss I knew exactly, and by playing them against each other and accounts nowhere close in rating (min losses and max wins), and logging exactly when each account went from positive to negative, I could make sure I had the right K-value.

That latter part didn’t work.  I got a reasonable value out of the first measured match- K of about 20.25- but it was clear that subsequent matches were not behaving exactly as expected, and there was no value of K, and no combination of K and minloss, that would fix things.  I couldn’t find a mistake in my match logging, (although I knew better than to completely rule it out), and the only other obvious simple source of error was the 3:1 assumption.

I’d only measured 13 wins offsetting 39 losses, which looked good, but certainly wasn’t a definitive 3.0000:1.  So, of course the only way to measure this more precisely was to lose a crapload of games and see exactly how many wins it took to offset them.  And that came out to a breakeven win% of 24.32%.  And I did it again on a bigger samples, and came out with 24.37% and 24.40%, and in absolutely wonderful news, there was no single value that was consistent with all measurements.  The breakeven win% in those samples really had slightly increased.  FML.

Now that the system clearly wasn’t just Elo, and the breakeven W:L ratio was somehow at least slightly dynamic, I went in for another round of measurements in May.  The first thing I noticed was that I got from my initial Mythic seed to a 0 rating MUCH faster than I had when deranking later in the month.  And by later in the month, I mean anything after the first day or 2 of the season, not just actually late in the month.

When deranking my reference account (the big negative number I need for precise measurements), the measured number of minlosses was about 1.6 times as high as expected from the number of matches conceded, and I had 4 other accounts hovering around a 0 rating who benchmarked and played each other in the short window of time when I controlled the #1500 player, and all of those measurements were consistent with each other.  The calculated reference ratings were different by 1 in the 6th significant digit, so I have confidence in that measurement.

I got a similar K-value as the first time, but I noticed something curious when I was setting up the accounts for measurements.  Whereas before, with the breakeven win% at 24.4%, 3 losses and 1 win (against much-higher rated players, i.e. everybody but me) was a slight increase in rating.  Early in May, it was a slight *decrease* in rating, so the breakeven win% against the opponents I played was slightly OVER 25%, the first time I’d seen that.  And as of a few days ago, it was back to being an increase in rating.  I still don’t have a clear explanation for that, although I do have an idea or two.

Once I’d done my measurements and calculations, I had a reference account with a rating equal to a known number of minlosses-at-that-time, and a few other accounts with nothing better to do than to lose games to see how or if the value of a minloss changed over a month.  If I started at 0, and took X minlosses, and my reference account was at -Y minlosses, then if the value of a minloss is constant, the Mythic Percentile ratio and X/Y ratio should be the same, which is what I was currently in the process of measuring.  And, obviously, measuring that precisely requires.. conceding craploads of games.  What I got was consistent with no change, but not to the precision I was aiming for before this all blew up.

So this meant that the rating change from a minloss was not stable throughout the month- it was much higher at the very beginning, as seen from my reference account, but that it probably had stabilized- at least for my accounts playing each other- by the time the 1500th Mythic arrived on May 7 or 8.  That’s quite strange.  Combined with the prior observation where approximately the bare minimum number of games to make mythic did NOT cause an increase in the minloss value, this wasn’t a function of my games played, which were already far above the games played on that account from deranking to 0.

In Glicko, the “K-value” of a match depends on the number of games you’ve played (more=lower, but we know that’s irrelevant after this many games), the inactivity period (more=higher, but also known to be irrelevant here), and the number of games your opponent has played (more=higher, which is EXACTLY BACKWARDS here).  So the only Glicko-relevant factor left is behaving strongly in the wrong direction (obviously opponents on May 1 have fewer games played, on average, than opponents on May 22).

So something else is spiking the minloss value at the beginning of the month, and I suspect it’s simply a quickly decaying function of time left/elapsed in the month.  Instead of an inactivity term, I suspect WotC just runs a super-high K value/change multiplier/whatever at the start of the month that calms down pretty fast over the first week or so.  I had planned to test that by speedrunning a couple of accounts to Mythic at the start of June, deranking them to 0 rating, and then having each account concede some number of games sequentially (Account A scoops a bunch of matches on 6/2, Account B scoops a bunch of matches on 6/3, etc) and then seeing what percentile they ended up at after we got 1500 mythics.  Even though they would have lost the same number of matches from 0, I expected to see A with a lower percentile than B, etc, because of that decaying function.  Again, something that can only be measured by conceding a bunch of matches, and something in the system completely unrelated to the Glicko they told us they were running.  If you’re wondering why it’s taking months to try to figure this stuff out, well, it’s annoying when every other test reveals some new “feature” that there was no reason to suspect existed.

Problems

Rating-based pairing below Mythic is absurdly exploitable and manifestly unfair

I’m not the first person to discover it.  I’ve seen a couple of random reddit posts suggesting conceding a bunch of matches at the start of the season, then coasting to Mythic.  This advice is clearly correct if you just want to make Mythic.  It’s not super-helpful trying to make Mythic on day 1, because there’s not that much nonsense (or really weak players) in Diamond that early, but later in the month, the Play button may as well say Click to Win if you’re decent and your rating is horrible.

When you see somebody post about their total jankfest making Mythic after going 60% in Diamond or something, it’s some amount of luck, but they probably played even worse decks, tanked their rating hard at Diamond 4, and then found something marginally playable and crushed the bottom of the barrel after switching decks.  Meanwhile, halfway decent players are preferentially paired against other decent players and don’t get anywhere.

Rating-based pairing might be appropriate at the bottom level of each rank (Diamond 4, Plat 4, etc), just so people can try nonsense in ranked and not get curbstomped all the time, but after that, it should be random same-rank pairing with no regard to rating (using ratings to pair in Draft, to some extent, has valid reasons that don’t exist in Constructed, and the Play Queue is an entirely different animal altogether).

Of course, my “should” is from the perspective of wanting a fairer and unexploitable ladder climb, and WotC’s “should” is from the perspective of making it artificially difficult for more invested players to rank up by giving them tougher pairings (in the same rank), presumably causing them to spend more time and money to make progress in the game.

Bo3 K is WAY too high

Several things should jump out at you if you’re familiar with either Magic or Elo.  First, given the same initial participant ratings, winning consecutive Bo1 games rewards fewer points (X + slightly fewer than X) than winning one Bo3 (~2.2X), even though going 2-0 is clearly a more convincing result.  There’s no rating-accuracy justification whatsoever for Bo3 being double the K value of Bo1.  1.25x or 1.33x might be reasonable, although the right multiplier could be even lower than that.  Second, while a K-value of 20.5 might be a bit on the aggressive side for Bo1 among well-established players (chess, sports), ~45 for a B03 is absolutely batshit.

Back when WotC used Elo for organized play, random events had K values of 16, PTQs used 32, and Worlds/Pro Tours used 48.  All for one B03.  The current implementation on Arena is using ~20.5 for  Bo1 and a near-pro-tour K-value for one random Bo3 ladder match.  Yeah.

The ~75%-25% cap is far too narrow

While not many people have overall 75% winrates in Mythic, it seems utterly implausible, both from personal experience and from things like the MtG Elo Project, that when strong players play weaker players, the aggregate matchup isn’t more lopsided than that.  After conceding bunches of games at Plat 4 to get a low rating, my last three accounts went 51-3, 49-1, 48-2 to reach Mythic from Plat 4.  When doing my massive “measure the W:L ratio” experiment last month, I was just over 87% winrate (in almost 750 matches) in Mythic when trying to win, and that’s in Bo1, mostly on my phone while multitasking, and I’m hardly the second coming of Finkel, Kai, or PVDDR (and I didn’t “cheat” and concede garbage and play good starting hands- I was either playing to win every game or to snap-concede every game).  Furthermore, having almost the same ~75%-25% cap for both Bo1 and Bo3 is self-evidently nonsense when the cap is possibly in play.

The Elo formula is supposed to ensure that any two swaths of players are going to be close to equilibrium at any given time, with minimal average point flow if they keep getting paired against each other, but with WotC’s truncated implementation, when one group actually beats another more than 75% of the time, and keeps getting rewarded as though they were only supposed to win 75%, the good players farm (expected) points off the weaker players every time they’re paired up.  I reached out to the makers of several trackers to try to get a large sample of the actual results when two mythic %s played each other, but the only one who responded didn’t have the data.  I can certainly believe that Magic needs something that declines in a less extreme fashion than the Elo curve for large rating differences, but a 75%-25% cap is nowhere close to the correct answer.

An Overlooked Change

With the Ikoria release in April 2020, Gold was changed to be 2 pips of progress per win instead of 1, making it like Silver.  This had the obvious effect of letting weak/new players make Platinum while before they got stuck in Gold.   I suspected that this may have allowed a bunch more weaker players to make it to Mythic late in the month, and this looks extremely likely to be correct.

I obviously don’t have population data for each rank, but since Mythic resets to Plat, I created a toy model of 30k Plats ~N(1600,85), 90k Golds ~N(1450,85), 150k Silvers ~N(1300,85) constant talent level, started each player at rating=talent, and simulated what happened as it got back to 30k people in Mythic.  In each “iteration”, people played random Bo1 K=22 matches in the same rank, and Diamonds played 4 matches, Plats 3, Golds/Silvers 2 per iteration.  None of these are going to be exact obviously, but the basic conclusions below are robust over huge ranges of possibly reasonable assumptions.

As anybody should expect, the players who make Mythic later in the month are much weaker on average than the ones who make it early.  In the toy model, the average Mythic talent was 1622, the first 20% to make Mythic are over 1700 talent on average (and almost nobody got stuck in Gold).  The last 20% are about 1560.  The cutoff for the top-10% talentwise (Rank 3000 out 30000) is about 1790.  You may be able to see where this is going.

I reran the simulation using two different parameters- first, I made Gold the way it used to be- 1 pip per win and per loss.  About 40% of people got stuck in Gold in this simulation, and the average Mythic player was MUCH stronger- 1695 vs 1622.  There were also under 1/3 as many, 8800 vs 30,000 (running for the same number of iterations).  The late-month Mythics are obviously still weaker here, but 1650 here on average instead of 1560.  That’s a huge difference.

I also ran a model where Silver/Gold populations were 1/4 of their starting size (representing lots of people making Plat since it’s easy and then quitting before they play against those in the higher ranks).  That’s 30k starting in Plat and 60k starting below Plat who continue to play in Plat, which seems like a quite conservative ratio to me. This came out roughly in the middle of the previous two.  The average Mythic was 1660 and the late-season Mythics were around 1607 on average.  It doesn’t require an overwhelming infusion into Plat to create a big effect on who makes it to Mythic late in the month.

Influx of Players and Overrated Players

The first part is obvious from the previous paragraph.  A lot more people in Mythic is going to push the #1500 rating higher by variance alone, even if the newbies mostly aren’t that good.

Because WotC doesn’t use anything like a provisional rating, where a Mythic rating is based on the first X number of games at Mythic, and instead seems to give everybody fairly similar ratings throughout the month when they first make Mythic, the players who make it late in the month are MASSIVELY overrated relative to the existing population, on the order of 100+ Elo or more.  Treating early-season Mythics and late-season Mythics as separate populations, when two players from the same group play each other, the group keeps the same average rating,  When cross-group play happens, the early-season Mythics farm the hell out of the late-season Mythics (because they’re weaker, but rated the same) until a new equilibrium is reached.  And with lots more (weaker) players making Mythic because of the change to Gold, there’s a lot of farming to be done.

This effectively makes playing late in the month positive-sum for good players because there are tons of new fish to farm showing up every day.  It also indirectly punishes people who camp at the end of the month because they can’t collect the free points if they aren’t playing.  This was likely always a significant cause of rank decay, but the easier path to Mythic gives a clear explanation of why rank decay is so much more severe now than it was pre-Ikoria: more players and lots more fish.  The influx of weak players also means more people in the queue for good players to 75-25 farm, even after equilibration, but I expect that effect is smaller than the direct point donation.

New-player ratings are a solved problem in chess and were implemented in a proper Glicko framework in the mid-90s.  WotC used the dumb implementation, “everybody starts at 1600”, for competitive paper magic back in the day, and that had the exact same problem then as their Mythic seeding procedure does now- people late to the party are weaker than average, by a lot, and while their MTG:A implementation added a fancy wrapper, it still appears to be making the same fundamental mistake that they made 25 years ago.

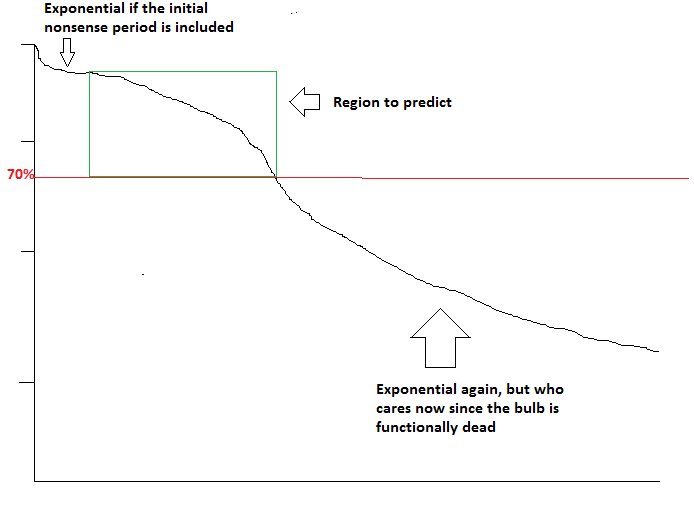
This is a graph of the #1500 rating in April as the month progressed.  I got it from my reference account’s percentile changing (with a constant actual rating) as the month progressed.

The part on the left is when there are barely more than 1500 people in Mythic at all, and on the right is the late-month rating inflation.  Top-1200 inflation was likely even worse (it was in January at least).  The middle section of approximately a straight line is more interesting than it seems.  In a normal-ish distribution, once you get out of the stupid area equivalent to the left of this graph, adding more people to the distribution increases the #1500 rating in a highly sub-linear way.  To keep a line going, and to actually go above linear near the end, requires some combination of beyond-exponential growth in the Mythic population through the whole month and/or lots of fish-farming by the top end.  I have no way to try to measure how much of each without bulk tracker data, but I expect both to matter.  And both would be tamped down if Gold were still +1/-1.

Conclusions

Cutting way back on rating-based pairing in Constructed would create a much fairer ladder climb before Mythic and take away the easy-mode exploit.  Bringing the Bo3 K way down would create a more talent-based distribution at the top of Mythic instead of a giant crapshoot.  A better Mythic seeding algorithm would offset the increase in weak players making it late in the month.  The ~75-25 cap.. I just don’t even.  I’ll leave it to the reader’s imagination as to why their algorithm does what it does and why the details have been kept obfuscated for years now.

P.S. Apologies to anybody who was annoyed by queueing into me.  I was hoping a quick free win wouldn’t be that bad.  At Bo3 K-values, the rating result of any match is 95% gone inside 50 matches, so conceding to somebody early in the month is completely irrelevant to the final positioning, and due to rating-based pairing, I didn’t get matched very often against real T-1200 contenders later on.  Going over 100 games without seeing a single 90% or higher was not strange.

A survey about future behavior is not future behavior

People lie their asses off all the time give incorrect answers to survey questions about future actions.  This is not news.  Any analysis that requires treating such survey results as reality should be careful to validate them in some way first, and when simple validation tests show that the responses are complete bullshit significantly inaccurate in systematically biased ways, well, the rest of the analysis is quite suspect to say the least.

Let’s start with a simple hypothetical.  You see a movie on opening weekend (in a world without COVID concerns).  You like it and recommend it to a friend at work on Monday.  He says he’ll definitely go see it.  6 weeks later (T+6 weeks), the movie has left the theaters and your friend never did see it.  Clearly his initial statement did not reflect his behavior.  Was he lying from the start? Did he change his mind?

Let’s add one more part to the hypothetical.  After 3 weeks (T+3 weeks), you ask him if he’s seen it, and he says no, but he’s definitely going to go see it. Without doing pages of Bayesian analysis to detail every extremely contrived behavior pattern, it’s a safe conclusion under normal conditions (the friend actually does see movies sometimes, etc) that his statement is less credible now than it was 3 weeks ago.   Most of the time he was telling the truth initially, he would have seen the movie by now.  Most of the time he was lying, he would not have seen the movie by now.  So compared to the initial statement three weeks ago, the new one is weighted much more toward lies.

There’s also another category of behavior- he was actually lying before but has changed his mind and is now telling you the truth, or he was telling you the truth before, but changed his mind and is lying now.  If you somehow knew with certainty (at T+3 weeks) that he had changed his mind one way or the other , you probably don’t have great confidence right now in which statement was true and which one wasn’t.

But once another 3 weeks pass without him seeing the movie, by the same reasoning above, it’s now MUCH more likely that he was in the “don’t want to see the movie” state at T+3 weeks, and that he told the truth early and changed his mind against the movie.  So at T+6 weeks, we’re in a situation where the person said the same words at T and T+3, but we know he was 1) much more likely to have been lying about wanting to see the movie at T+3 than at T, and 2) at T+3, much more likely to have changed his mind against seeing the movie than to have changed his mind towards seeing the movie.

Now let’s change the schedule a little.  This example is trivial, but it’s here for completeness and I use the logic later.  Let’s say it’s a film you saw at a festival, in a foreign language, or whatever, and it’s going to get its first wide release in 7 weeks.  You tell your friend about it, he says he’s definitely going to see it.  Same at T+3, same at T+6 (1 week before release).  You haven’t learned much of anything here- he didn’t see the movie, but he *couldn’t have* seen the movie between T and T+6, so the honest responses are all still in the pool.  The effect from before- more lies, and more mind-changing against the action- arises from not doing something *that you could have done*, not just from not doing something.

The data points in both movie cases are exactly the same.  It requires an underlying model of the world to understand that they actually mean vastly different things.

This was all a buildup to the report here https://twitter.com/davidlazer/status/1390768934421516298 claiming that the J&J pause had no effect on vaccine attitudes.  This group has done several surveys of vaccine attitudes, and I want to start with Report #43 which is a survey done in March, and focus on the state-by-state data at the end.

We know what percentage of eligible recipients have been vaccinated (in this post, vaccinated always means having received at least one dose of anything) in each state when I pulled CDC data on 5/9, and comparing survey results to that number.  First off, everybody (effectively every marginal person) in the ASAP category could have gotten a vaccine by now, and effectively everybody in the “after some people I know” category has seen “some people they know” get the vaccine.  The sum of vaccinated + ASAP + After Some comes out, on average, 3.4% above the actual vaccinated rate.  That, by itself, isn’t a huge deal.  It’s slight evidence of overpromising, but not “this is total bullshit and can’t be trusted” level.  The residuals on the other hand..

Excess vaccinations = % of adults vaccinated – (Survey Vaxxed% + ASAP% + After some%)

State Excess Vaccinations
MS -17.5
LA -15.7
SC -15.3
AL -12.9
TN -12.5
UT -10.5
IN -10.2
WV -10.1
MO -9.5
AK -8.7
TX -8.5
NC -7.9
DE -7.8
WA -7.6
NV -7.4
AZ -7.3
ID -7.2
ND -7.2
GA -7
MT -6.2
OH -5.1
KY -5
CO -4
AR -3.9
FL -3.7
IA -3.5
SD -3.4
MI -3.3
NY -2.7
KS -2.2
CA -2.1
NJ -1.8
VA -1.8
WI -1.7
OR -1.5
WY -1.2
HI -0.7
NE -0.4
OK 1.3
PA 2.3
IL 2.5
CT 3.4
RI 3.9
MN 4.1
MD 5.5
VT 7.8
ME 10.2
NH 10.7
NM 11.1
MA 14.2

This is practically a red-state blue-state list.  Red states systematically undershot their survey, and blue states systematically overshot their survey.  In fact, correlating excess vaccination% to Biden%-Trump% has an R^2 of 0.25, and a linear regression of survey results to the CDC vaccination %s on 5/9 is only 0.39.  Partisan response bias is a big thing here, and the big takeaway is that answer groups are not close to homogeneous.  Answer groups can’t properly be modeled as being composed of identical entities.  There are plenty of liars/mind-changers in the survey pool, many more than could be detected by just looking at one top-line national number.

Respondents in blue states who answered ASAP or After Some are MUCH more likely to have been vaccinated by now, in reality, than respondents in red states who answered the same way (ASAP:After Some ratio was similar in both red and blue states).  This makes the data a pain to work with, but this heterogeneity also means that the MEANING of the response changes, significantly, over time.

In March, the ASAP and After Some groups were composed of people who were telling the truth and people who were lying.  As vaccine opportunities rolled out everywhere, the people who were telling the truth and didn’t change their mind (effectively) all got vaccinated by now, and the liars and mind-changers mostly did not. By state average, 46% of people answered ASAP or After Some, and 43% got vaccinated between the survey and May 8 (including some from the After Most or No groups of course).  I can’t quantify exactly how many of the ASAP and After Some answer groups got vaccinated (in aggregate), but it’s hard to believe it’s under 80% and could well be 85%.

That means most people in the two favorable groups were telling the truth, but there were still plenty of liars as well, so that group has morphed from a mostly honest group in March to a strongly dishonest group now.  The response stayed the same- the meaning of the response is dramatically different now.  People who said it in March mostly got vaccinated quickly.  Now, not so much.

This is readily apparent in Figure 1 in Report 48.  That is a survey done throughout April, split to before, during, and after the J&J pause.  Their top-line numbers for people already vaccinated were reasonably in line with CDC figures, so their sampling probably isn’t total crap.   But if you add the numbers up, Vaxxed + ASAP + After Some is 70%, and the actual vaccination rate after 5/8 was only 58%.  About 16% of the US got vaccinated between the median date on the pre-pause survey and 5/8, and from other data in the report, 1-2% of that was likely to be from the After Most or No groups, so 14-15% got vaccinated from the ASAP/After Some groups, and that group comprised 27% of the population.  That’s a 50-55% conversion rate (down from 80+% conversion rate in March), and every state had been fully open for at least 3 weeks.  Effectively any person capable of filling out their online survey who made any effort at all could have gotten a shot by now, meaning that aggregate group was now up to almost half liars.

During the pause, about 8% got vaccinated between the midpoint and 5/8, ~1% from After Some and No, so 7% vaccinated from 21% of the population, meaning that aggregate group was now 2/3 liars.  And after the pause, 4% vaccinated, maybe 0.5% from After Some and No, and 18% of the population, so the aggregate group is now ~80% liars.  The same responses went from 80% honest (really were going to get vaccinated soon) in March to 80% dishonest (not so much) in late April.

Looking at the crosstabs in Figure 2 (still report 48) also bears this out.  In the ASAP group, 38% really did get vaccinated ASAP, 16% admitted shifting to a more hostile posture, and 46% still answered ASAP, except we know from figure 1 that means ~16% were ASAP-honest and ~30% were ASAP-lying (maybe a tad more honest here and a tad less honest in the After Some below, but in aggregate, it doesn’t matter)

In the After Some group, 23% got vaccinated and 35% shifted to actively hostile.  9% upgraded to ASAP, and 33% still answered After Some, which is more dishonest than it was initially.  This is a clear downgrade in sentiment even if you didn’t acknowledge the increased dishonesty, and an even bigger one if you do.

If you just look at the raw numbers and sum the top 2 or 3 groups, you don’t see any change, and the hypothesis of J&J not causing an attitude change looks plausible.  Except we know, by the same logic as the movie example above, the same words *coupled with a lack of future action* – not getting vaccinated between the survey and 5/8- discount the meaning of the responses.

Furthermore, we know from Report #48, Figure 2 that plenty of people self-reported mind-changes, and we have a pool that contained a large number of people who lied at least once (because we’re way, way below the implied 70% vax rate, and also the red-state/blue-state thing), so it would be astronomically unlikely for the “changed mind and then lied” group to be a tiny fraction of the favorable responses after the pause.  These charts show the same baseline favorability (vaxxed + ASAP + Almost Some), but the correct conclusion -because of lack of future action- is that this most likely reflected a good chunk of mind-changing against the vaccine and lying about it, coupled with people who were lying all along, and that “effectively no change in sentiment” is a gigantic underdog to be the true story.

If you attempt to make a model of the world and see if survey responses, actual vaccination data, actual vaccine availability over time, and the hypothesis of J&J not causing an attitude change fit into a coherent model, it simply doesn’t work at all, and the alternative model- selection bias turning the ASAP and After Some groups increasingly and extremely dishonest (as the honest got vaccinated and left the response group while the liars remained) fits the world perfectly.

The ASAP and After Some groups were mostly honest when it was legitimately possible for a group of that size to not have vaccine access yet (not yet eligible in their state or very recently eligible and appointments full, like when the movie hadn’t been released yet), and they transitioned to dishonest as reality moved towards it being complete nonsense for a group of that size to not have vaccine access yet (everybody open for 3 weeks or more).


P.S. There’s another line of evidence that has nothing to do with data in the report that strongly suggests that attitudes really did change.  First of all, comparing the final pre-pause week (4/6-4/12) to the first post-resumption week (4/24-4/30, or 4/26-5/2 if you want lag time), vaccination rate was down 33.5% (35.5%) post-resumption and was down in all 50 individual states.  J&J came back and everybody everywhere was still in the toilet.  Disambiguating an exhaustion of willing recipients from a decrease in willingness is impossible using just US aggregate numbers, but grouping states by when they fully opened to 16+/18+ gives a clearer picture.

Group 1 is 17 states that opened in March.  Compared to the week before, these states were +8.6% in the first open week and +12.9% in the second.  This all finished before (or the exact day of) the pause.

Group 2 is 14 states that opened 4/5 or 4/6.  Their first open week was pre-pause and +11%, and their second week was during the pause and -12%.  That could have been supply disruption or attitude change, and there’s no way to tell from just the top-line number.

Group 3 is 8 states that opened 4/18 or 4-19.  Their prior week was mostly paused, their first week open was mostly paused, and their second week was fully post-resumption.  Their opening week was flat, and their second open week was *-16%* despite J&J returning.

We would have expected a week-1 bump and a week-2 bump.  It’s possible that the lack of a week-1 bump was the result of running at full mRNA throughput capacity both weeks (they may have even had enough demand left from prior eligibility groups that they wouldn’t have opened 4/19 without Biden’s decree, and there were no signs of flagging demand before the pause), but if that were true, a -16% change the week after, with J&J back, is utterly incomprehensible without a giant attitude change (or some kind of additional throughput capacity disruption that didn’t actually happen).

The “exhaustion of the willing” explanation was definitely true in plenty of red states where vaccination rates were clearly going down before the pause even happened, but it doesn’t fit the data from late-opening states at all.  They make absolutely no sense without a significant change in actual demand.


The hidden benefit of pulling the ball

Everything else about the opportunity being equal, corner OFs have a significantly harder time catching pulled balls  than they do catching opposite-field balls.  In this piece, I’ll demonstrate that the effect actually exists, try to quantify it in a useful way, and give a testable take on what I think is causing it.

Looking at all balls with a catch probability >0 and <0.99 (the Statcast cutoff for absolutely routine fly balls), corner OF out rates underperform catch probability by 0.028 on pulled balls relative to oppo balls.

(For the non-baseball readers, position 7 is left field, 8 is center field, 9 is right field, and a pulled ball is a right-handed batter hitting a ball to left field or a LHB hitting a ball to right field.  Oppo is “opposite field”, RHB hitting the ball to right field, etc.)

Stands Pos Catch Prob Out Rate Difference N
L 7 0.859 0.844 -0.015 14318
R 7 0.807 0.765 -0.042 11380
L 8 0.843 0.852 0.009 14099
R 8 0.846 0.859 0.013 19579
R 9 0.857 0.853 -0.004 19271
L 9 0.797 0.763 -0.033 8098

The joint standard deviation for each L-R difference, given those Ns, is about 0.005, so .028+/- 0.005, symmetric in both fields, is certainly interesting.  Rerunning the numbers on more competitive plays, 0.20<catch probability<0.80

Stands Pos Catch Prob Out Rate Difference N
L 7 0.559 0.525 -0.034 2584
R 7 0.536 0.407 -0.129 2383
L 9 0.533 0.418 -0.116 1743
R 9 0.553 0.549 -0.005 3525

Now we see a much more pronounced difference, .095 in LF and .111 in RF (+/- ~.014).  The difference is only about .01 on plays between .8 and .99, so whatever’s going on appears to be manifesting itself clearly on competitive plays while being much less relevant to easier plays.

Using competitive plays also allows a verification that is (mostly) independent of Statcast’s catch probability.  According to this Tango blog post, catch probability changes are roughly linear to time or distance changes in the sweet spot at a rate of 0.1s=10% out rate and 1 foot = 4% out rate.  By grouping roughly similar balls and using those conversions, we can see how robust this finding is.  Using 0.2<=CP=0.8, back=0, and binning by hang time in 0.5s increments, we can create buckets of almost identical opportunities.  For RF, it looks like

Stands Hang Time Bin Avg Hang Time Avg Distance N
L 2.5-3.0 2.881 30.788 126
R 2.5-3.0 2.857 29.925 242
L 3.0-3.5 3.268 41.167 417
R 3.0-3.5 3.256 40.765 519
L 3.5-4.0 3.741 55.234 441
R 3.5-4.0 3.741 55.246 500
L 4.0-4.5 4.248 69.408 491
R 4.0-4.5 4.237 68.819 380
L 4.5-5.0 4.727 81.487 377
R 4.5-5.0 4.714 81.741 204
L 5.0-5.5 5.216 93.649 206
R 5.0-5.5 5.209 93.830 108

If there’s truly a 10% gap, it should easily show up in these bins.

Hang Time to LF Raw Difference Corrected Difference Catch Prob Difference SD
2.5-3.0 0.099 0.104 -0.010 0.055
3.0-3.5 0.062 0.059 -0.003 0.033
3.5-4.0 0.107 0.100 0.013 0.032
4.0-4.5 0.121 0.128 0.026 0.033
4.5-5.0 0.131 0.100 0.033 0.042
5.0-5.5 0.080 0.057 0.023 0.059
Hang Time to RF Raw Difference Corrected Difference Catch Prob Difference SD
2.5-3.0 0.065 0.096 -0.063 0.057
3.0-3.5 0.123 0.130 -0.023 0.032
3.5-4.0 0.169 0.149 0.033 0.032
4.0-4.5 0.096 0.093 0.020 0.035
4.5-5.0 0.256 0.261 0.021 0.044
5.0-5.5 0.168 0.163 0.044 0.063

and it does.  Whatever is going on is clearly not just an artifact of the catch probability algorithm.  It’s a real difference in catching balls.  This also means that I’m safe using catch probability to compare performance and that I don’t have to do the whole bin-and-correct thing any more in this post.

Now we’re on to the hypothesis-testing portion of the post.  I’d used the back=0 filter to avoid potentially Simpson’s Paradoxing myself, so how does the finding hold up with back=1 & wall=0?

Stands Pos Catch Prob Out Rate Difference N
R 7 0.541 0.491 -0.051 265
L 7 0.570 0.631 0.061 333
R 9 0.564 0.634 0.071 481
L 9 0.546 0.505 -0.042 224

.11x L-R difference in both fields.  Nothing new there.

In theory, corner OFs could be particularly bad at playing hooks or particularly good at playing slices.  If that’s true, then the balls with more sideways movement should be quite different than the balls with less sideways movement.  I made an estimation of the sideways acceleration in flight based on hang time, launch spray angle, and landing position and split balls into high and low acceleration (slices have more sideways acceleration than hooks on average, so this is comparing high slice to low slice, high hook to low hook).

Batted Spin Stands Pos Catch Prob Out Rate Difference N
Lots of Slice L 7 0.552 0.507 -0.045 1387
Low Slice L 7 0.577 0.545 -0.032 617
Lots of Hook R 7 0.528 0.409 -0.119 1166
Low Hook R 7 0.553 0.402 -0.151 828
Lots of Slice R 9 0.540 0.548 0.007 1894
Low Slice R 9 0.580 0.539 -0.041 972
Lots of Hook L 9 0.526 0.425 -0.101 850
Low Hook L 9 0.546 0.389 -0.157 579

And there’s not much to see there.  Corner OF play low-acceleration balls worse, but on average those are balls towards the gap and somewhat longer runs, and the out rate difference is somewhat-to-mostly explained by corner OF’s lower speed getting exposed over a longer run.  Regardless, nothing even close to explaining away our handedness effect.

Perhaps pull and oppo balls come from different pitch mixes and there’s something about the balls hit off different pitches.

Pitch Type Stands Pos Catch Prob Out Rate Difference N
FF L 7 0.552 0.531 -0.021 904
FF R 7 0.536 0.428 -0.109 568
FF L 9 0.527 0.434 -0.092 472
FF R 9 0.556 0.552 -0.004 1273
FT/SI L 7 0.559 0.533 -0.026 548
FT/SI R 7 0.533 0.461 -0.072 319
FT/SI L 9 0.548 0.439 -0.108 230
FT/SI R 9 0.553 0.592 0.038 708
Other L 7 0.569 0.479 -0.090 697
Other R 7 0.541 0.379 -0.161 1107
Other L 9 0.534 0.385 -0.149 727
Other R 9 0.550 0.497 -0.054 896

The effect clearly persists, although there is a bit of Simpsoning showing up here.  Slices are relatively fastball-heavy and hooks are relatively Other-heavy, and corner OF catch FBs at a relatively higher rate.  That will be the subject of another post.  The average L-R difference among paired pitch types is still 0.089 though.

Vertical pitch location is completely boring, and horizontal pitch location is the subject for another post (corner OFs do best on outside pitches hit oppo and worst on inside pitches pulled), but the handedness effect clearly persists across all pitch location-fielder pairs.

So what is going on?  My theory is that this is a visibility issue.  The LF has a much better view of a LHB’s body and swing than he does of a RHB’s, and it’s consistent with all the data that looking into the open side gives about a 0.1 second advantage in reaction time compared to looking at the closed side.  A baseball swing takes around 0.15 seconds, so that seems roughly reasonable to me.  I don’t have the play-level data to test that myself, but it should show up as a batter handedness difference in corner OF reaction distance and around a 2.5 foot batter handedness difference in corner OF jump on competitive plays.

Wins Above Average Closer

It’s HoF season again, and I’ve never been satisfied with the dicsussion around relievers.  I wanted something that attempted to quantify excellence at the position while still being a counting stat, and what better way to quantify excellence at RP than by comparing to the average closer?  (Please treat that as a rhetorical question)

I used the highly scientific method of defining the average closer as the aggregate performance of the players who were top-25 in saves in a given year, and I used several measures of wins.  I wanted something that used all events (so not fWAR) and already handled run environment for me, and comparing runs as a counting stat across different run environments is more than a bit janky, so that meant a wins-based metric.  I went with REW (RE24-based wins), WPA, and WPA/LI. 

IP as the denominator instead of PA/TBF because I wanted any (1-inning, X runs) and any inherited runner situation (X outs gotten to end the inning, Y runs allowed – entering RE) to grade out the same regardless of batters faced.  Not that using PA as the denominator would make much difference.

The first trick was deciding on a baseline Wins/IP to compare against because the “average closer” is significantly better now than 1974, to the tune of around 0.5 normalized RA/9 better. 

I used the regression as the baseline Wins/IP for each season/metric because I was more interested in excellence compared to peers than compared to players who were pitching significantly different innings/appearance.  WPA/LI/IP basically overlaps REW/IP and makes it all harder to see, so I left it off.

For each season, a player’s WAAC is (Wins/IP – baseline wins/IP) * IP, computed separately for each win metric.

Without further ado, the top 20 in WAAC (REW-based) and the remaining HoFers.  Peak is defined as the optimal start and stop years for REW.  Fangraphs doesn’t have Win Probability stats before 1974, which cuts out all of Hoyt Wilhelm, but by a quick glance, he’s going to be top-5, solidly among the best non-Rivera RPs.  I also miss the beginning of Fingers’s career, but it doesn’t matter. 

Career WAAC based on REW WPA WPA/LI Peak REW Peak Years
Mariano Rivera 16.9 26.6 18.6 16.9 1996-2013
Billy Wagner 7.3 7.2 7.3 7.3 1996-2010
Joe Nathan 6.6 12.6 7.5 8.5 2003-2013
Zack Britton 5.4 7.0 4.1 5.4 2014-2020
Craig Kimbrel 5.2 6.9 4.3 6.3 2010-2018
Keith Foulke 4.9 4.1 5.3 7.2 1999-2004
Tom Henke 4.9 5.8 5.7 5.8 1985-1995
Aroldis Chapman 4.2 4.1 4.7 4.6 2012-2019
Rich Gossage 4.1 7.4 4.8 10.8 1975-1985
Andrew Miller 3.8 3.5 3.2 5.4 2012-2017
Wade Davis 3.8 3.5 3.7 5.6 2012-2017
Trevor Hoffman 3.8 8.0 6.1 5.8 1994-2009
Darren O’Day 3.7 -1.2 1.8 4.1 2009-2020
Rafael Soriano 3.5 2.8 2.8 4.3 2003-2012
Jonathan Papelbon 3.5 9.7 4.8 5 2006-2009
Eric Gagne 3.4 8.5 3.6 4.3 2002-2005
Dennis Eckersley (RP) 3.4 -0.3 5.2 7.1 1987-1992
John Wetteland 3.3 7.1 4.9 4.2 1992-1999
John Smoltz (RP) 3.2 9.0 3.5 3.2 2001-2004
Kenley Jansen (#20) 3.1 2.6 3.5 4.3 2010-2017
Lee Smith (#25) 2.5 0.9 1.8 4.5 1981-1991
Rollie Fingers (#64) 0.7 -6.0 0.8 1.9 1975-1984
Bruce Sutter (#344) 0.0 2.4 3.6 4.3 1976-1981

Mariano looks otherworldly here, but it’s hard to screw that up.  We get a few looks at really aberrant WPAs, good and bad, which is no shock because it’s known to be noisy as hell.  Peak Gossage was completely insane.  His career rate stats got dragged down by pitching forever, but for those 10 years (20.8 peak WPA too), he was basically Mo.  That’s the longest imitation so far.

Wagner was truly excellent.  And he’s 3rd in RA9-WAR behind Mo and Goose, so it’s not like his lack of IP stopped him from accumulating regular value.  Please vote him in if you have a vote.

It’s also notable how hard it is to stand out or sustain that level.  Only one other player is above 3 career WAAC (Koji).  There are flashes of brilliance (often mixed with flashes of positive variance), but almost nobody sustained “average closer” performance for over 10 years.  The longest peaks are (a year skipped to injury/not throwing 10 IP in relief doesn’t break it, it just doesn’t count towards the peak length):

Rivera 17 (16 with positive WAAC)

Wagner 15 (12 positive)

Hoffman 15 (9 positive)

Wilhelm 13 (by eyeball)

Smith 11 (10 positive)

Henke 11 (10 positive)

Fingers 11 (8 positive, giving him 1973)

O’Day 11 (7 positive)

and that’s it in the history of baseball.  It’s pretty tough to pitch that well for that many years.  

This isn’t going to revolutionize baseball analysis or anything, but I thought it was an interesting look that went beyond career WAR/career WPA to give a kind of counting stat for excellence.

RLCS X viewership is being manipulated

TL;DR EU regionals weekend 1 viewership was still fine, but legit viewership never cracked 80k even though the reported peak was over 150k.

Psyonix was cooperative enough to leave the Sunday stream shenanigan-free, so we have a natural comparison between the two days.  Both the Saturday and Sunday streams had the same stakes- half of the EU teams played each day trying to qualify for next weekend- so one would expect viewership each day to be pretty similar, and in reality, this was true. Twitch displays total viewers for everyone to see, and the number of people in the chatroom is available through the API, and I track it. (NOT the number of people actually chatting- you’re in the chatroom if you’re logged in, viewing normally, and didn’t go out of your way to close chat.  The fullscreen button doesn’t do it, and it appears that closing chat while viewing in squad mode doesn’t remove you from the chatroom either).  Only looking at people in the chatroom on Saturday and Sunday gives the following:

RLCSXeu1-1inchat

That’s really similar, as expected.  Looking at people not in the chatroom- the difference between the two numbers- tells an entirely different story.

RLCSXeu1-1notinchat

LOL.  Alrighty then.  Maybe there’s a slight difference?

Large streams average around 70% of total viewers in chat.  Rocket League, because of drops, averages a bit higher than that.  More people make Twitch accounts and watch under those accounts to get rewards.  Sunday’s stream is totally in line with previous RLCS events and with the big events in the past offseason.  Saturday’s stream is.. not.  On top of the giant difference in magnitude, the Sunday number/percentage is pretty stable, while the Saturday number bounces all over the place.  Actual people come and go in approximately equal ratios whether they’re logged in or not.  At the very end of Saturday’s stream, it was on the Twitch frontpage, which boosts the not-in-chat count, but that doesn’t explain the rest of the time.

The answer is that the Saturday stream was embedded somewhere outside of Twitch.  Twitch allows a muted autoplay stream video in a random webpage to count as a viewer even if the user never interacts with the stream (a prominent media source said otherwise last year.  He was almost certainly wrong then, and I’ve personally tested in the past 2 months that he’s wrong now), and, modern society being what it is, services and ad networks exist to place muted streams where ~nobody pays any attention to them to boost apparent viewcount, and publishers pay 5 figures to appear to be more popular than they are. Psyonix/RLCS was listed as a client of one of these services before and has a history of pulling bullshit and buying fake viewers. There’s a nice article on kotaku detailing this nonsense across more esports.

If the stream were embedded somewhere it belonged, instead of as an advertisement to inflate viewcount, it’s hard to believe it also wouldn’t have been active on Sunday, so it’s very likely they’re just pulling bullshit and buying fake viewers again.  If somebody at Psyonix comments and explains otherwise, I’ll update the post, but don’t hold your breath.  Since a picture speaks a thousand words:

RLCSXeu1-1notinchat


Nate Silver vs AnEpidemiolgst

This beef started with this tweet https://twitter.com/AnEpidemiolgst/status/1258433065933824008

which is just something else for multiple reasons.  Tone policing a neologism is just stupid, especially when it’s basically accurate.  Doing so without providing a preferred term is even worse.  But, you know, I’m probably not writing a post just because somebody acted like an asshole on twitter.  I’m doing it for far more important reasons, namely:

duty_calls

And in this particular case, it’s not Nate.  She also doubles down with https://twitter.com/JDelage/status/1258452085428928515

which is obviously wrong, even for a fuzzy definition of meaningfully, if you stop and think about it.  R0 is a population average.  Some people act like hermits and have little chance of spreading the disease much if they somehow catch it.  Others have far, far more interactions than average and are at risk of being superspreaders if they get an asymptomatic infection (or are symptomatic assholes).  These average out to R0.

Now, when 20% of the population is immune (assuming they develop immunity after infection, blah blah), who is it going to be?  By definition, it’s people who already got infected.  Who got infected?  Obviously, for something like COVID, it’s weighted so that >>20% of potential superspreaders were already infected and <<20% of hermits were infected.  That means that far more than the naive 20% of the interactions infected people have now are going to be with somebody who’s already immune (the exact number depending on the shape and variance of the interaction distribution), and so Rt is going to be much less than (1 – 0.2) * R0 at 20% immune, or in ELI5 language, 20% immune implies a lot more than a 20% decrease in transmission rate for a disease like COVID.

This is completely obvious, but somehow junk like this is being put out by Johns Hopkins of all places.  Right-wing deliberate disinformation is bad enough, but professionals responding with obvious nonsense really doesn’t help the cause of truth.  Please tell me the state of knowledge/education in this field isn’t truly that primitive.    Or ship me a Nobel Prize in medicine, I’m good either way.