TL;DR Using Sprint Speed, Reaction, and Burst from the Statcast leaderboard pages, with no catch information (or other information) of any kind, is enough to make a good description of same-season outfield OAA and that descriptive stat makes a better prediction of next-season outfield OAA than current-season OAA does.
A recently-released not-so-great defensive metric inspired me to repurpose an old idea of mine and see how well I could model outfield defense without knowing any actual play results, and the answer is actually pretty well. Making catches in the OF, taking positioning as a given as OAA does, is roughly based on five factors- reacting fast, accelerating fast, running fast, running to the right place, and catching the balls you’re close enough to reach.
Reacting fast has its own leaderboard metric (reaction distance, the distance traveled in the first 1.5s), as does running fast (Sprint Speed, although it’s calculated on offense). Acceleration has a metric somewhat covering it, although not as cleanly, in Burst (distance traveled between 1.5s and 3s). Running to the right place only has the route metric, which covers the first 3s only and is very confounded and doesn’t help nontrivially, so I don’t use it, and actually catching the balls is deliberately left out of the FID metric (I do provide a way to incorporate catch information into next season’s estimation at the end of each section).
2+ Star Plays
The first decision was what metric to try to model first, and I went with OAA/n on 2+ star plays over OAA/n for all plays for multiple reasons. 2+ star plays are responsible for the vast majority of seasonal OAA, OAA/n on 2+ star plays correlates at over r=0.94 to OAA/n on all plays (same season), so it contains the vast majority of the information in OAA/n anyway, and the three skills I’m trying to model based on aren’t put on full display on easier balls. Then I had to decide how to incorporate the three factors (Sprint Speed, Reaction, Burst). Reaction and Burst are already normalized to league-average, and I normalized sprint speed to the average OF speed weighted by the number of 2+ star opportunities they got (since that’s the average sprint speed of the 2+* sample). That can get janky early in a season before a representative sample has qualified for the leaderboard, so in that case it’s probably better to just use the previous season’s average sprint speed as a baseline for awhile as there’s not that much variation.
| year |
weighted avg OF Sprint Speed |
| 2016 |
27.82 |
| 2017 |
27.93 |
| 2018 |
28.01 |
| 2019 |
27.93 |
| 2020 |
27.81 |
| 2021 |
27.94 |
| 2022 |
28.00 |
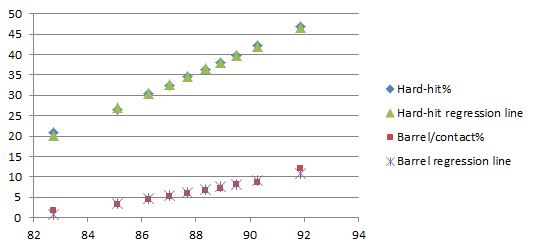
Conveniently each stat individually was pretty linear in its relationship to OAA/n 2+* (50+ 2* opportunities shown).


Reaction isn’t convincingly near-linear as opposed to some other positively-correlated shape, but it’s also NOT convincingly nonlinear at all, so we’ll just go with it.
The outlier at 4.7 reaction is Enrique Hernandez who seems to do this regularly but didn’t have enough opportunities in the other seasons to get on the graph again. I’m guessing he’s deliberately positioning “slightly wrong” and choosing to be in motion with the pitch instead of stationary-ish and reacting to it. If more players start doing that, then this basic model formulation will have a problem.

Reaction Distance and Sprint Speed are conveniently barely correlated, r=-.09, and changes from year to year are correlated at r=0.1. I’d expect the latter to be closer to the truth, given that for physical reasons there should be a bit of correlation, and there should be a bit of “missing lower left quadrant” bias in the first number where you can’t be bad at both and still get run out there, but it seems like the third factor to being put in the lineup (offense) is likely enough to keep that from being too extreme.
Burst, on the other hand, there’s no sugarcoating it. Correlation of r=0.4 to Reaction Distance (moving further = likely going faster at the 1.5s point, leading to more distance covered in the next 1.5s) and r=0.56 to Sprint Speed for obvious reasons. I took the easy way out with only one messy variable and made an Expected Burst from Reaction and Sprint Speed (r=0.7 to actual Burst), and then took the residual Burst – Expected Burst to create Excess Burst and used that as the third input. I also tried a version with Sprint Speed and Excess Bootup Distance (distance traveled in the correct direction in the first 3s) as a 2-variable model, and it still “works”, but it’s significantly worse in both description and prediction. Excess Burst also looks fine as far as being linear with respect to OAA/n.

Looking at how the inputs behave year to year (unless indicated otherwise, all correlations are with players who qualified for Jump stats to be calculated (10+ 2-star opportunities) and Sprint Speed leaderboard (10+ competitive runs) in both years, and correlations are weighted by year T 2+ star opportunities)
| weighted correlation r-values (N=712) |
itself next season |
same-season OAA/n 2+* |
next-season OAA/n 2+* |
| Sprint Speed above avg |
0.91 |
0.49 |
0.45 |
| Reaction |
0.85 |
0.40 |
0.35 |
| Burst |
0.69 |
0.79 |
0.60 |
| Excess Burst |
0.53 |
0.41 |
0.21 |
Sprint Speed was already widely known to be highly reliable year-over-year, so no surprise there, and Reaction grades out almost as well, but Burst clearly doesn’t, particularly in the year-to-year drop in correlation to OAA/n. Given that the start of a run (Reaction) holds up year-to-year, and that the end of the run (Sprint Speed) holds up year-to-year, it’s very strange to me that the middle of the run wouldn’t. I could certainly believe a world where there’s less skill variation in the middle of the run, so the left column would be smaller, but that doesn’t explain the dropoff in correlation to OAA/n. Play-level data isn’t available, but what I think is happening here is that because Burst is calculated on ALL 2+* plays, it’s a mixture of maximum burst AND how often a player chose to use it, because players most definitely don’t bust ass for 3 seconds on plenty of the 2+* plays they don’t get close to making (and this isn’t even necessarily wrong on any given play, getting in position to field the bounce and throw can be the right decision)
I would expect maximum burst to hold up roughly as well as Reaction or Sprint Speed in the OAA/n correlations, but the choice component is the kind of noisy yes-no variable that takes longer to stabilize than a stat that’s closer to a physical attribute. While there’s almost no difference in Sprint Speed year-to-year correlation for players with 60+ attempts (n=203) and players with 30 or fewer attempts (n=265), r=0.92 to 0.90, there’s a huge dropoff in Burst, r=0.77 to r=0.57.
This choice variable is also a proxy for making catches- if you burst after a ball that some players don’t, you have a chance to make a catch that they won’t, and if you don’t burst after a ball that other players do, you have no chance to make a catch that they might. That probably also explains why the Burst metric and Excess Burst are relatively overcorrelated to same-season OAA/n.
Now that we’ve discussed the components, let’s introduce the Fielding-Independent Defense concept. It is a DESCRIPTIVE stat, the values of A/B/C/D in FID=(A + B* Reaction + C* Sprint Speed above average + D* Excess Burst) that minimizes SAME-SEASON opportunity-weighted RMSE between FID and OAA/n on whatever plays we’re looking at (here, 2+ star plays). Putting FID on the success probability added scale (e.g. if Statcast had an average catch probability of 50% on a player’s opportunities, and he caught 51%, he’s +1% success probability, and if FID expects him to catch 52%, he’d be +2% FID), I get
FID = 0.1% + 4.4% * Reaction + 5.4% * Sprint Speed above average + 6.4% * Excess Burst.
In an ideal world, the Y intercept (A) would be 0, because in a linear model, somebody who’s average at every component should be average, but our Sprint Speed above average here is above the weighted average of players who had enough opportunities to have stats calculated, which isn’t exactly the average including players who didn’t, so I let the intercept be free, and 0.1% on 2+ star plays is less than 0.1 OAA over a full season, so I’m not terribly worried at this point. And yeah, I know I’m nominally adding things that don’t even use the same units (ft vs. ft/s) and coming up with a number in outs/opportunity, so be careful porting this idea to different measurement systems because the coefficients would need to be converted from ft-1 etc.
So, how well does it do?
| weighted correlation r-values (N=712) |
itself next season |
same-season OAA/n 2+* |
next-season OAA/n 2+* |
| FID 2+* |
0.748 |
0.806 |
0.633 |
| OAA/n 2+* |
0.591 |
1.000 |
0.591 |
| OAA-FID |
0.156 |
0.587 |
0.132 |
| Regressed FID and (OAA-FID) |
0.761 |
0.890 |
0.647 |
That’s pretty darn good for a purely descriptive stat that doesn’t know the outcome of any play, although 2+* plays do need physical skills more than 0-1* plays. The OAA-FID residual- actual catch information- does contain some predictive value, but it doesn’t help a ton. The regression amounts I came up with (the best fit regression for FID and OAA-FID together to predict next season’t OAA/n on 2+*) were 12 opportunities for FID and 218 opportunities for OAA-FID. Given that a full-time season is 70-80 2+ star opportunities on average (more for CF, fewer for corner), FID is half-real in a month and OAA-FID would be half-real if a season lasted 18 straight months. Those aren’t the usual split-sample correlations, since there isn’t any split-sample data available, but regressions based on players with different numbers of opportunities. That has its own potential issues, but 12 and 218 should be in the ballpark. FID stabilizes super-fast.
0 and 1 Star Plays
Since 0 and 1 star plays have a catch probability of at least 90%, there’s an upper bound on success probability added, and while players reaching +10% on 2+* plays isn’t rare, obviously that’s not going to translate over directly to a 105% catch rate on 0/1* plays. I did the same analysis for 0-1* plays as for 2+* plays using the 2+* metrics as well as a FID fit specifically for 0-1* plays. Everything here is weighted by the player’s number of 0-1* opportunities in year T.
| weighted correlation r-values (N=712) |
itself next season |
same-season OAA/n 0/1* |
next-season OAA/n 0/1* |
| FID 2+* |
0.75 |
0.20 |
0.25 |
| OAA/n 2+* |
0.59 |
0.27 |
0.27 |
| OAA-FID 2+* |
0.15 |
0.18 |
0.11 |
| FID reweighted for only 0/1* |
0.75 |
0.22 |
0.26 |
| OAA/n 0/1* |
0.13 |
1.00 |
0.13 |
| OAA-FID 0/1* |
0.07 |
0.97 |
0.07 |
The obvious takeaway is that these correlations suck compared to the ones for 2+* plays, and that’s the result of there being a much larger spread in talent in the ability to catch 2+* balls compared to easier ones. 2* plays are ~25% of the total plays, but comprise ~80% of a player’s OAA. 0-1* plays are 3 times as numerous and comprise ~20% of OAA. OAA on 0-1* plays is just harder to predict because there’s less signal in it as seen by it self-correlating horrendously.
The other oddities are that OAA/n on 2+* outcorrelates FID from 2+* and that both FIDs do better on the next season than the current season. For the former, the residual OAA-FID on 2+* plays has a comparable signal, and 0-1* plays are a lot more weighted to “catch the ball” skill relative to physical skills than 2+* plays are, and OAA and especially the residual weight “catch the ball” heavily, so that’s my best guess for that. As to why FID correlates better to next season, I don’t have a great explanation there. It was odd enough that I recreated the entire analysis from scratch, but I just got the same thing again. I broke it down by year and didn’t see anything strange there either. 2020 correlated worse, of course, but everything is attempt-weighted so that shouldn’t much matter for same-season correlations.
Reaction time grades out relatively much less important in comparison to Sprint Speed and Burst for these plays than it did on 2+* plays, not shockingly.
All plays together
Doing the same analysis on all plays, and comparing the 2+* metrics to the all-play metrics, we get
| weighted correlation r-values (N=712) |
itself next season |
same-season OAA/n all plays |
next-season OAA/n all plays |
| FID 2+* |
0.749 |
0.758 |
0.627 |
| OAA/n 2+* |
0.589 |
0.943 |
0.597 |
| OAA-FID 2+* |
0.154 |
0.559 |
0.153 |
| FID Reweighted for all plays |
0.751 |
0.759 |
0.628 |
| OAA/n all plays |
0.601 |
1.000 |
0.601 |
| OAA-FID all plays |
0.210 |
0.629 |
0.173 |
| Regressed FID and (OAA-FID) 2+* only |
0.760 |
0.842 |
0.642 |
| Regressed FID and (OAA-FID) all plays |
0.763 |
0.894 |
0.652 |
with regression numbers of 35 opportunities for all-play FID and 520 (~2 full seasons) opportunities for all-play OAA-FID. As a descriptive stat, you get basically everywhere you’re going to go with FID just by looking at 2* plays, and that’s also enough to outpredict last season’s OAA/n for all plays. The relative weights are fairly similar here- 1:1.34:1.57 Reaction:Sprint Speed:Excess Burst for all plays compared to 1:1.23:1.48 for only 2+* plays, with Reaction relatively a bit less important when considering all plays as expected given the 0-1* section. The equation for all plays is:
FID = 0.08% + 1.12% * Reaction + 1.50% * Sprint Speed above average + 1.76% * Excess Burst.
The coefficients are smaller than the 2+* version because there’s less variation in OAA/n than in 2+* plays, but to convert to a seasonal number, there are roughly 4 times as many total plays as 2+* plays, so it all works out. A hypothetical player who’s +1.0 in all components would be +16.3% on 2+star plays and +4.46% on all plays. Given a breakdown of 70 2+* attempts and 210 0/1* attempts for 280 total attempts in a season, this person would be expected to be +12.5 OAA overall, +11.4 OAA on 2+* plays and +1.1 OAA on 0/1* plays.
Defensive Aging
FID also allows a quick look at where aging comes from across the paired seasons. Sprint Speed is roughly a straight line down with age, and it’s the biggest driver of decline by far.
|
Reaction |
Sprint Speed above avg |
Excess Burst |
Total |
FID (all) |
OAA.n (all) |
| Change |
-0.0410 |
-0.1860 |
0.0133 |
|
-0.0030 |
-0.0029 |
| Expected Impact (in catch %) |
-0.046% |
-0.279% |
0.023% |
-0.302% |
-0.302% |
-0.285% |
That’s around a 0.9 drop in seasonal OAA on average from getting a year older that’s a very good match for the decline predicted by worse FID components. As a rough rule of thumb, 1 marginal foot in reaction distance is worth 3 OAA over a full year, 1 ft/s in Sprint Speed is worth 4 OAA, and 1 foot in Excess Burst is worth 5 OAA.
Conclusion
Sprint Speed, Reaction Distance, and Excess Burst really do cover most of the skill variation in defense, and by the time players have reached the major league level, their routes and ability to catch the ball are sufficiently good that those differences are overwhelmed by physical differences. This measure depends on that being true- at lower levels, it might not hold as well and the regression number for OAA-FID could drop much lower to where you’d be throwing away a lot of information by not considering OAA-FID. It’s also definitely vulnerable to Goodhart’s law- “When a measure becomes a target, it ceases to be a good measure“. It’s hard to uselessly game your FIP to be much lower than it would be if you were pitching normally, but without play-level data (or observation) to detect players in motion at the pitch, anybody who wanted to game FID could probably do it pretty easily.