RLCS X viewership is being manipulated

TL;DR EU regionals weekend 1 viewership was still fine, but legit viewership never cracked 80k even though the reported peak was over 150k.

Psyonix was cooperative enough to leave the Sunday stream shenanigan-free, so we have a natural comparison between the two days.  Both the Saturday and Sunday streams had the same stakes- half of the EU teams played each day trying to qualify for next weekend- so one would expect viewership each day to be pretty similar, and in reality, this was true. Twitch displays total viewers for everyone to see, and the number of people in the chatroom is available through the API, and I track it. (NOT the number of people actually chatting- you’re in the chatroom if you’re logged in, viewing normally, and didn’t go out of your way to close chat.  The fullscreen button doesn’t do it, and it appears that closing chat while viewing in squad mode doesn’t remove you from the chatroom either).  Only looking at people in the chatroom on Saturday and Sunday gives the following:

RLCSXeu1-1inchat

That’s really similar, as expected.  Looking at people not in the chatroom- the difference between the two numbers- tells an entirely different story.

RLCSXeu1-1notinchat

LOL.  Alrighty then.  Maybe there’s a slight difference?

Large streams average around 70% of total viewers in chat.  Rocket League, because of drops, averages a bit higher than that.  More people make Twitch accounts and watch under those accounts to get rewards.  Sunday’s stream is totally in line with previous RLCS events and with the big events in the past offseason.  Saturday’s stream is.. not.  On top of the giant difference in magnitude, the Sunday number/percentage is pretty stable, while the Saturday number bounces all over the place.  Actual people come and go in approximately equal ratios whether they’re logged in or not.  At the very end of Saturday’s stream, it was on the Twitch frontpage, which boosts the not-in-chat count, but that doesn’t explain the rest of the time.

The answer is that the Saturday stream was embedded somewhere outside of Twitch.  Twitch allows a muted autoplay stream video in a random webpage to count as a viewer even if the user never interacts with the stream (a prominent media source said otherwise last year.  He was almost certainly wrong then, and I’ve personally tested in the past 2 months that he’s wrong now), and, modern society being what it is, services and ad networks exist to place muted streams where ~nobody pays any attention to them to boost apparent viewcount, and publishers pay 5 figures to appear to be more popular than they are. Psyonix/RLCS was listed as a client of one of these services before and has a history of pulling bullshit and buying fake viewers. There’s a nice article on kotaku detailing this nonsense across more esports.

If the stream were embedded somewhere it belonged, instead of as an advertisement to inflate viewcount, it’s hard to believe it also wouldn’t have been active on Sunday, so it’s very likely they’re just pulling bullshit and buying fake viewers again.  If somebody at Psyonix comments and explains otherwise, I’ll update the post, but don’t hold your breath.  Since a picture speaks a thousand words:

RLCSXeu1-1notinchat


Mythic Championship III Day 1-Blatant viewer manipulation and group breakdowns

First off, the level of view-count fraud was absolutely out of control today. The bullshit today (ht: darrenoc on reddit) isn’t particularly different than the bullshit they pulled with the Mythic Invitational, but the actual viewership today was anemic to begin with.  From the time I first checked, around the start of round 2, until the end of round 8, the number of people in chat (chat being sub-only is ~irrelevant to this) was between 9,000 and 11,500.  Since 70-75% of viewers in most large channels are logged in to chat, that’s a real viewership of 12k-16k. Going slightly above that isn’t impossible, but not by too much.

The nominal viewership I saw got as high as 65k, which means that literally 75-80%, or very close, of the reported viewer count was completely fake.  Once WotC stopped paying for new fake views, and the numbers started decaying as the day wound down, total views dropped from the 60-thousands to the 20-thousands while the actual people logged into chat- representative of real viewers- stayed in the same 9k-11.5k range.  It’s utterly and blatantly fraudulent. There’s a long section about WotC’s viewer fraud in this Kotaku article (open it and ctrl-f magic), and if it’s correct, WotC is spending *hundreds of thousands of dollars per event* for the sole purpose of creating transparently fraudulent viewer numbers.

That’s utterly disgusting.


On to the actual day 1 results.. I’m sure there will be several metagame breakdowns posted elsewhere, so I’m not bothering with that, especially since I had to go derive and input round 7 and 8 results by hand because the official page had this……………..

lolround7

and round 8 results still aren’t up, but I was mainly curious how the different kinds of players did.

I classified the players into 4 groups:  MPL members, pros/ex-pros, challengers, and invited personalities from the extra 16 invites (lists at the bottom of the post).  The only questionable classification was former PT champion Simon Görtzen, who does commentary now instead of playing.  I put him with the pros/ex-pros based on his pro history and that he wasn’t one of the extra invites.  These are the performances of each group vs. each other group.

left vs. top MPL Pro/ex-pro Challenger Personality
MPL 42-42 19-22 27-18 18-12
 Pro/ex-pro 22-19 11-11 7-6 6-3
Challenger 18-27 6-7 8-8 5-5
Personality 12-18 3-6 5-5 9-9

.

Combining the group performances and looking at day 2 conversion rates (not counting the 4 MPL players with byes into day 2) gives

vs. out of group out of group win% day 2 day 2 advance
MPL 64-52 55.2% 6/28 21.4%
Pro/ex-pro 35-28 55.6% 5/13 38.5%
Challenger 29-39 42.6% 1/13 7.7%
Personality 20-29 40.8% 0/10 0%

Looks like the pros crushed it, taking it to the MPL 22-19 while the MPL went 45-30 against the challengers and personalities.  There’s a marked difference between those who are/have been at the top of the game and those who’ve never come close.


————————————————————————————————————

Player lists (Bold = day 2)

MPL:

Alexander Hayne
Andrea Mengucci
Andrew Cuneo
Autumn Burchett
Ben Stark
Carlos Romao
Christian Hauck
Eric Froehlich
Grzegorz Kowalski
Janne Mikkonen
Javier Dominguez
Jean Emmanuel Depraz
Jessica Estephan
John Rolf
Lee Shi Tian
Lucas Esper Berthoud
Luis Salvatto
Marcio Carvalho
Martin Juza
Matthew Nass
Mike Sigrist
Paulo Vitor Damo da Rosa
Piotr Glogowski
Reid Duke
Seth Manfield
Shahar Shenhar
Shota Yasooka
William Jensen

Pros/ex-pros:

Allen Wu
Andrew Elenbogen
Ben Hull
Corey Burkhart
Greg Orange
Kai Budde
Kentaro Yamamoto

Luis Scott Vargas
Noah Walker
Ondrej Strasky
Raphaël Lévy
Simon Görtzen
Wyatt Darby

Challengers:

Alexey Shashov
André Santos
CJ Steele
Eric Oresick
Evan Gascoyne
Marcin Tokajuk
Matias Leveratto
Montserrat Ayensa
Nicholas Carlson
Patrick Fernandes
Takashi Iwasaki
Yuki Matsuda
Yuma Koizumi

Personalities:

Amy Demicco
Ashley Espinoza
Audrey Zoschak
Emma Handy
Giana Kaplan
Jason Chan
Jeffrey Brusi
Nhi Pham
Teresa Pho
Vanessa Hinostroza


Revisiting the DRC+ team switcher claim

The algorithm has changed a fair bit since I investigated that claim- at the least, it’s gotten rid of most of its park factor and regresses (effectively) less than it used to.  It’s not impossible that it could grade out differently now than it did before, and I told somebody on twitter that I’d check it out again, so here we are.  First of all, let’s remind everybody what their claim is.  From https://www.baseballprospectus.com/news/article/45383/the-performance-case-for-drc/, Jonathan Judge says:


Table 2: Reliability of Team-Switchers, Year 1 to Year 2 (2010-2018); Normal Pearson Correlations[3]

Metric Reliability Error Variance Accounted For
DRC+ 0.73 0.001 53%
wOBA 0.35 0.001 12%
wRC+ 0.35 0.001 12%
OPS+ 0.34 0.001 12%
OPS 0.33 0.002 11%
True Average 0.30 0.002 9%
AVG 0.30 0.002 9%
OBP 0.30 0.002 9%

With this comparison, DRC+ pulls far ahead of all other batting metrics, park-adjusted and unadjusted. There are essentially three tiers of performance: (1) the group at the bottom, ranging from correlations of .3 to .33; (2) the middle group of wOBA and wRC+, which are a clear level up from the other metrics; and finally (3) DRC+, which has almost double the reliability of the other metrics.

You should pay attention to the “Variance Accounted For” column, more commonly known as r-squared. DRC+ accounts for over three times as much variance between batters than the next-best batting metric. In fact, one season of DRC+ explains over half of the expected differences in plate appearance quality between hitters who have switched teams; wRC+ checks in at a mere 16 percent.  The difference is not only clear: it is not even close.

Let’s look at Predictiveness.  It’s a very good sign that DRC+ correlates well with itself, but games are won by actual runs, not deserved runs. Using wOBA as a surrogate for run-scoring, how predictive is DRC+ for a hitter’s performance in the following season?

Table 3: Reliability of Team-Switchers, Year 1 to Year 2 wOBA (2010-2018); Normal Pearson Correlations

Metric Predictiveness Error
DRC+ 0.50 0.001
wOBA 0.37 0.001
wRC+ 0.37 0.002
OPS+ 0.37 0.001
OPS 0.35 0.002
True Average 0.34 0.002
OBP 0.30 0.002
AVG 0.25 0.002

If we may, let’s take a moment to reflect on the differences in performance we see in Table 3. It took baseball decades to reach consensus on the importance of OBP over AVG (worth five points of predictiveness), not to mention OPS (another five points), and finally to reach the existing standard metric, wOBA, in 2006. Over slightly more than a century, that represents an improvement of 12 points of predictiveness. Just over 10 years later, DRC+ now offers 13 points of improvement over wOBA alone.


Reading that, you’re pretty much expecting a DIPS-level revelation.  So let’s see how good DRC+ really is at predicting team switchers.  I put DRC+ on the wOBA scale, normalized each performance to the league-average wOBA that season (it ranged from .315 to .326), and measured the mean absolute error (MAE) of wOBA projections for the next season, weighted by the harmonic mean of the PAs in each season.  DRC+ had a MAE of 34.2 points of wOBA for team-switching position players.  Projecting every team-switching position player to be exactly league average had a MAE of 33.1 points of wOBA.  That’s not a mistake.  After all that build-up, DRC+ is literally worse at projecting team-switching position players than assuming that they’re all league average.

If you want to say something about pitchers at the plate…
i-dont-think-so-homey-dont-play-that


Even though Jonathan Judge felt like calling me a total asshole incompetent troll last night, I’m going to show how his metric could be not totally awful at this task if it were designed and quality-tested better.  As I noted yesterday, DRC+’s weightings are *way* too aggressive on small numbers of PAs.  DRC+ shouldn’t *need* to be regressed after the fact- the whole idea of the metric is that players should only be getting credit for what they’ve shown they deserve (in the given season), and after a few PAs, they barely deserve anything, but DRC+ doesn’t grasp that at all and its creator doesn’t seem to realize or care that it’s a problem.

If we regress DRC+ after the fact to see what happens in an attempt to correct that flaw, it’s actually not a dumpster fire.  All weightings are harmonic means of the PAs.  Every position player pair of consecutive 2010-18 seasons with at least 1 PA in each is eligible.  All tables are MAEs in points of wOBA trying to project year T+1 wOBA..

First off, I determined the regression amounts for DRC+ and wOBA to minimize the weighted MAE for all position players, and that came out to adding 416 league average PAs for wOBA and 273 league average PAs for DRC+.  wOBA assigns 100% credit to the batter.  DRC+ *still* needs to be regressed 65% as much as wOBA.  DRC+ is ridiculously overaggressive assigning “deserved” credit.

Table 1.  MAEs for all players

lgavg raw DRC+ raw wOBA reg wOBA reg DRC+
33.21 31.00 33.71 29.04 28.89

Table 2. MAEs for all players broken down by year T PAs

Year T PA lgavg raw DRC+ raw wOBA reg wOBA reg DRC+ T+1 wOBA
1-99 PAs 51.76 48.84 71.82 49.32 48.91 0.284
100-399 PA 36.66 36.64 40.16 34.12 33.44 0.304
400+ PA 30.77 27.65 28.97 25.81 25.91 0.328

Didn’t I just say DRC+ had a problem with being too aggressive in small samples?  Well, this is one area where that mistake pays off- because the group of hitters who have 1-99 PA over a full season are terrible, being overaggressive crediting their suckiness pays off, but if you’re in a situation like now, where the real players instead of just the scrubs and callups have 1-99 PAs, being overaggressive is terribly inaccurate.  Once the population mean approaches league-average quality, the need for- and benefit of- regression is clear. If we cheat and regress each bucket to its population mean, it’s clear that DRC+ wasn’t actually doing anything special in the low-PA bucket, it’s just that regression to 36 points of wOBA higher than the mean wasn’t a great corrector.

Table 3. (CHEATING) MAEs for all players broken down by year T PAs, regressed to their group means (same regression amounts as above).

Year T PA lgavg raw DRC+ raw wOBA reg wOBA reg DRC+ T+1 wOBA
1-99 PAs 51.76 48.84 71.82 46.17 46.30 0.284
100-399 PA 36.66 36.64 40.16 33.07 33.03 0.304
400+ PA 30.77 27.65 28.97 26.00 25.98 0.328

There’s very little difference between regressed wOBA and regressed DRC+ here.  DRC+ “wins” over wOBA by 0.00015 wOBA MAE over all position players, clearly justifying the massive amount of hype Jonathan Judge pumped us up with.  If we completely ignore the trash position players and only optimize over players who had 100+PA in year T, then the regression amounts increase slightly- 437 PA for wOBA and 286 for DRC+, and we get this chart:

Table 4. MAEs for all players broken down by year T PAs, optimized on 100+ PA players

Year T PA lgavg raw DRC+ raw wOBA reg wOBA reg DRC+ T+1 wOBA
100+ PA 32.55 30.37 32.36 28.32 28.19 0.321
100-399 PA 36.66 36.64 40.16 34.12 33.45 0.304
400+ PA 30.77 27.65 28.97 25.81 25.91 0.328

Nothing to see here either, DRC+ with a 0.00013 MAE advantage again.  Using only 400+PA players to optimize over only changes the DRC+ entry to 25.90, so regressed wOBA wins a 0.00009 MAE victory here.

In conclusion, regressed wOBA and regressed DRC+ are so close that there’s no meaningful difference, and I’d grade DRC+ a microscopic winner.  Raw DRC+ is completely awful in comparison, even though DRC+ shouldn’t need anywhere near this amount of extra regression if it were working correctly to begin with.

I’ve slowrolled the rest of the team-switcher nonsense.  It’s not very exciting either.  I defined 3 classes of players, Stay = played both years entirely for the same team, Switch = played year T entirely for 1 team and year T+1 entirely for 1 other team, Midseason = switched midseason in at least one of the years.

Table 5. MAEs for all players broken down by stay/switch, any number of year T PAs

stay/

switch

lgavg raw DRC+ raw wOBA reg wOBA reg DRC+ T+1 wOBA
stay 33.21 29.86 32.19 27.91 27.86 0.325
switch 33.12 34.20 37.89 31.57 31.53 0.312
mid 33.29 33.01 36.47 31.67 31.00 0.305
sw+mid 33.21 33.60 37.17 31.62 31.26 0.309

It’s the same story as before.  Raw DRC+ sucks balls at projecting T+1 wOBA and is actually worse than “everybody’s league average” for switchers, regressed DRC+ wins a microscopic victory over regressed wOBA for stayers and switchers.  THERE’S (STILL) LITERALLY NOTHING TO THE CLAIM THAT DRC+, REGRESSED OR OTHERWISE, IS ANYTHING SPECIAL WITH RESPECT TO PROJECTING TEAM SWITCHERS.  These are the same conclusions I found the first time I looked, and they still hold for the current version of the DRC+ algorithm.


DRC+ isn’t even a hitting metric

At least not as the term is used in baseball.  Hitting metrics can adjust for nothing (box score stats, AVG, OBP, etc), league and park (OPS+, wRC+, etc), or more detailed conditions (opposing pitcher and defense, umpire, color of the uniforms, proximity of Snoop Dogg, whatever).  They don’t adjust for the position played.  Hitting is hitting, regardless of who does it.  Unless it’s not.  While fooling around with the data for DRC+ really isn’t any good at predicting next year’s wOBA for team switchers and The DRC+ team-switcher claim is utter statistical malpractice some more, it looked for all the world like DRC+ had to be cheating, and it is.

To prove that, I looked at seasons with exactly 1 PA and 1 unintentional walk for the entire season, and the DRC+ for those seasons.

NAME
YEAR
TEAM
DRC+
DRC+ SD
Audry Perez
2014
Cardinals
104
20
Spencer Kieboom
2016
Nationals
96
29
John Hester
2013
Angels
93
16
Joey Gathright
2011
Red Sox
89
24
J.c. Boscan
2010
Braves
78
25
Mark Melancon
2011
Astros
15
14
George Sherrill
2010
Dodgers
4
23
Antonio Bastardo
2014
Phillies
3
22
Dan Runzler
2011
Giants
2
19
Jose Veras
2011
Pirates
1
15
Matt Reynolds
2010
Rockies
1
12
Tony Cingrani
2016
Reds
0
25
Antonio Bastardo
2017
Pirates
-1
17
Javy Guerra
2011
Dodgers
-2
31
Josh Stinson
2011
Mets
-10
11
Aaron Thompson
2011
Pirates
-12
14
Brandon League
2013
Dodgers
-13
17
J.j. Hoover
2014
Reds
-14
32
Santiago Casilla
2011
Giants
-15
12
Jason Garcia
2015
Orioles
-16
12
Chris Capuano
2016
Brewers
-17
17
Edubray Ramos
2016
Phillies
-19
15
Matt Guerrier
2011
Dodgers
-22
9
Liam Hendriks
2015
Blue Jays
-24
15
Phillippe Aumont
2015
Phillies
-28
20
Randy Choate
2015
Cardinals
-28
52
Joe Blanton
2017
Nationals
-30
12
Jacob Barnes
2017
Brewers
-31
26
Sean Burnett
2012
Nationals
-33
20
Robert Carson
2013
Mets
-43
7

That’s a pretty good spread.  The top 5 are position players, the rest are pitchers.  DRC+ is blatantly cheating by assigning pitchers very low DRC+ values even when their offensive performance is good and not doing the same for 1-PA position players.  wOBA and wRC+ don’t do this, as evidenced by Kieboom (#5) right there with 3 pitchers with the same seasonal stat line.  It’s also not using data from prior seasons because that was Kieboom’s only career PA to date, and when Livan Hernandez debuted in 1996 for one game with 1 PA and 1 single, he got a DRC+ of -14 for his efforts.  It’s just cheating, period.  And it doesn’t learn either.  Even when Bumgarner was hitting in 2014-2017, his DRC+s were -15, 4, -17, and -19.

I also included the DRC+ SDs here just to show that they’re complete nonsense.  Pitcher Mark Melancon (15 +/- 14) has one career PA. Pitcher Robert Carson (-43 +/- 7) also has one career PA. Pitcher Randy Choate (-28 +/- 52) had one PA that year and 5 a decade earlier.  What in the actual fuck?

The entire DRC+ project is a complete farce at this point.  The outputs are a joke***  The SD values are nonsense (table above). The pillars it stands on are complete bullshit.  It’s more descriptive of the current season than park adjusted stats because it’s not anywhere near a park-adjusted stat, even though it claims to be.  It’s more predictive than park-adjusted stats for next year’s team because it’s somewhat regressed, meaning it basically can’t lose, and it’s also cheating the same way descriptiveness does by keeping a bunch of park factor.  Its claimed “substantial improvement over predicting wOBA for team switchers” is statistical malpractice to begin with, and now we see that the one area where it did predict significantly better than regressed wOBA, very-low-PA players, is driven by (almost) ignoring actual results for pitchers and saying they sucked at the plate no matter how well they really hit (and treating low-PA position players with the exact same stat lines as average-ish).

***Check out DRA- land where Billy Wagner is 26 percent more valuable on a per-inning basis than Mariano Rivera and almost as valuable for his career.  I love Billy Wagner, but still, come on.

RIP 12/29/2018.  Comment F to pay respects.


The DRC+ team-switcher claim is utter statistical malpractice

Required knowledge: MUST HAVE READ/SKIMMED DRC+ really isn’t any good at predicting next year’s wOBA for team switchers and a non-technical knowledge of what a correlation coefficient means wouldn’t hurt.

In doing the research for the other post, it was baffling to me what BP could have been doing to come up with the claim that DRC+ was a revolutionary advance for team-switchers.  It became completely obvious that there was nothing particularly meaningful there with respect to switchers and that it would take a totally absurd way of looking at the data to come to a different conclusion.  With that in mind, I clicked some buttons and stumbled into figuring out what they had to be doing wrong.  One would assume that any sophisticated practitioner doing a correlation where some season pairs had 600+ PA each and other season pairs had 5 PA each would weight them differently… and one would be wrong.

I decided to check 4 simple ways of weighting the correlation- unweighted, by year T PA, by year T+1 PA, and by the harmonic mean of year T PA and year T+1 PA.

Table 1.  Correlation coefficients to year T+1 wOBA% by different weighting methods, minimum 400 PAs year T.

400+ PA Harmonic Year T PA Year T+1 PA unweighted N
switch wOBA 0.34 0.35 0.34 0.34 473
switch DRC+ 0.35 0.35 0.34 0.35 473
same wOBA 0.55 0.53 0.55 0.51 1124
same DRC+ 0.57 0.55 0.57 0.54 1124

The way to read this chart is to compare the wOBA and DRC+ correlations for each group of hitters- switch to switch (lines 1 and 2) and same to same (lines 3 and 4).  It’s obvious that wOBA should correlate much better for same than switch because it contains the entire park effect which is maintained in “same” and lost in “switch”, but DRC+ behaves the same way because DRC+ also contains a lot of park factor even though it shouldn’t

In the 400+ year T PA group, the choice of weighting method is almost completely irrelevant. DRC+ correlates marginally better across the board and it has nothing to do with switch or stay.  Let’s add group 2 to the mix and see what we get.

Table 2.  Correlation coefficients to year T+1 wOBA% by different weighting methods, minimum 100 PAs year T.

100+ PA Harmonic Year T PA Year T+1 PA unweighted N
switch wOBA 0.31 0.29 0.29 0.26 1100
switch DRC+ 0.33 0.31 0.32 0.29 1100
same wOBA 0.51 0.47 0.50 0.44 2071
same DRC+ 0.54 0.51 0.53 0.47 2071

The values change, but DRC+’s slight correlation lead doesn’t, and again, nothing is special about switchers except that they’re overall less reliable. Some of the gaps widen by a point or two, but there’s no real sign of the impending disaster when the low-PA stuff that favors DRC+ comes in.  But what a disaster there is….

Table 3.  Correlation coefficients to year T+1 wOBA% by different weighting methods, all season pairs.

1+ PA Harmonic Year T PA Year T+1 PA unweighted N
switch wOBA 0.45 0.41 0.38 0.37 1941
switch DRC+ 0.54 0.47 0.58 0.57 1941
same wOBA 0.62 0.58 0.53 0.52 3639
same DRC+ 0.67 0.62 0.66 0.66 3639

The two weightings (Harmonic and Year T) that minimize the weight of low-data garbage projections stay saner, and the two methods that don’t (year T+1 and unweighted) go bonkers and diverge by around what BP reports, If I had to guess, I have more pitchers in my sample for a slightly bigger effect and regressed DRC+% correlates a bit better.  And to repeat yet again, the effect has nothing to do with stay/switch.  It’s entirely a mirage based on flooding the sample with bunches of low-data garbage projections based on handfuls of PAs and weighting them equally to pairs of qualified seasons.

You might be thinking that that sounds crazy and wondering why I’m confident that’s what really happened.  Well, as it turns out- and I didn’t realize this until after the analysis- they actually freaking told us that’s what they did.  The caption for the chart is “Table 3: Reliability of Team-Switchers, Year 1 to Year 2 wOBA (2010-2018); Normal Pearson Correlations”.  Normal Pearson correlations are unweighted. Mystery confirmed solved.


Are Rocket League viewership numbers fraudulently high?

Maybe.  Quite possibly.  Something strange is going on. For the TL;DR crowd Season 6 EU playoff viewership (Sunday October 14, 2018) was abominably low, off by 10,000-20,000 viewers or up to a third of the regular audience, far worse than any other broadcast this season. Season 6 NA regional playoffs, held the day before (Saturday, October … Continue reading “Are Rocket League viewership numbers fraudulently high?”

Maybe.  Quite possibly.  Something strange is going on.

For the TL;DR crowd

  1. Season 6 EU playoff viewership (Sunday October 14, 2018) was abominably low, off by 10,000-20,000 viewers or up to a third of the regular audience, far worse than any other broadcast this season.
  2. Season 6 NA regional playoffs, held the day before (Saturday, October 13, 2018) were exactly in line with seasonal numbers.
  3. Regional playoff viewership was always fine-to-good for the other 7 Season 3-Season 6 regional playoff broadcasts
  4. There was an unnatural 15,000ish viewer bump late in the broadcast that can only realistically be a big host or major viewbot fraud
  5. Psyonix won’t comment at all and I can’t find other evidence of a large host
  6. Viewership of major events was trending way down coming into season 6


Background

The Rocket League Championship Series (RLCS) is a biannual competition featuring 8 teams from North America (NA), 8 teams from Europe (EU), and 8 teams from Oceania (OCE) each playing an online single-round-robin season over 5 weeks followed by an online regional playoff.  The top 4 teams from NA and EU and the top 2 teams from OCE then meet in person to crown the world champion for that season.  Psyonix, the maker of Rocket League, runs the NA and EU competitions and broadcasts every game on its Twitch stream.  A different entity is responsible for OCE and broadcasts those games on its own Twitch stream instead. We won’t worry about the OCE broadcasts.


Viewer counts increased significantly between seasons 3 and 4, slightly between 4 and 5, and were down about 20% in the current season 6, as the following graphs from esc.watch, an esports viewership tracker, show.  I have personally spot-checked esc.watch’s Rocket League charts over the past year and have always found them accurate.


The focus of this post will be the large decline in the season 6 EU playoff.  Note that season 3 NA has a slight decline in playoff viewership while every other playoff broadcast has been up or at least flat.  File that away for later. A couple of other easily  explainable anomalies need to be addressed first.  In season 3 (green), there was a week off between week 3 (April 2, 2017) and week 4 (April 16, 2017).  That resulted in lower viewership in week 4 in both NA and EU that rebounded to “normal” in the following 2 weeks of consecutive play.  Season 5 week 5 in EU had a large technical problem.  A power outage near the Psyonix studio cut the broadcast short after 2 games and the remaining 4 games were rescheduled for 12 PM Eastern on a Thursday in place of the regular 12 PM Eastern on Sunday.  That timeslot is obviously terrible in comparison for NA viewers and the low viewer count is quite understandable.  Season 4 week 5 in EU had a different technical problem.  The broadcast was fine, but twitch.tv did not send out notifications that the broadcast was starting and reportedly didn’t even show the Rocket League channel as being online.  Given the nature of viewership, which will be discussed next, it’s also quite understandable for that number to be in the toilet.


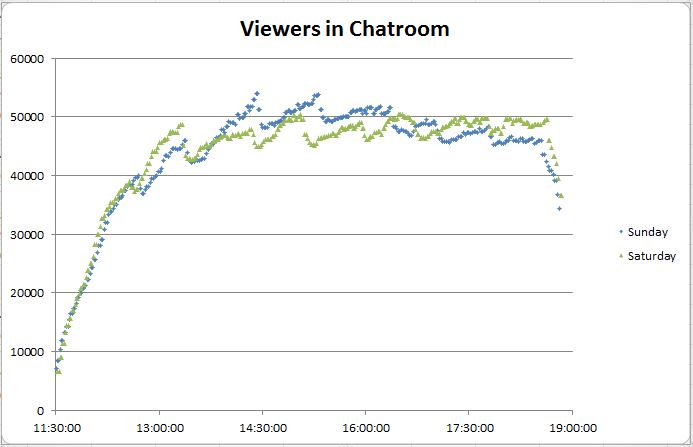
A typical RLCS broadcast accumulates most of its viewers over its first three matches like this (another reason that the EU S5 Week 5 broadcast being cut off after 2 games killed the viewership).

ctg0rf5

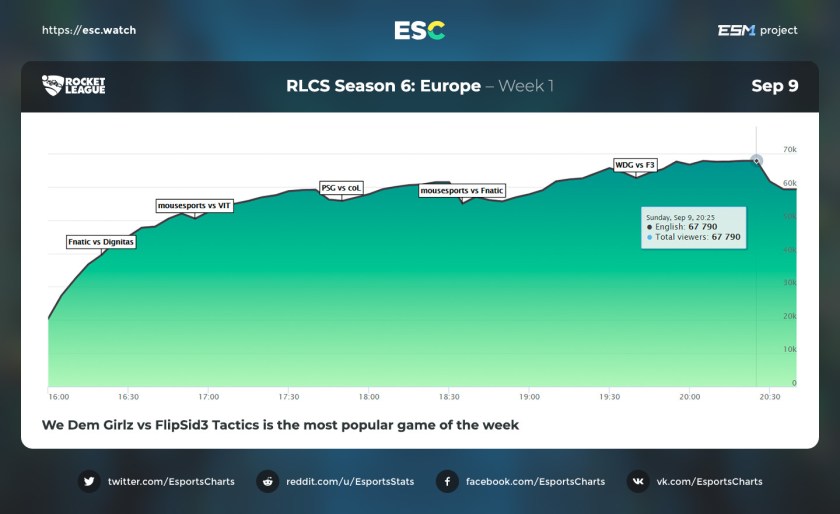
The viewership accumulates this way because it’s comprised of hardcore viewers, those who are ready for the start of the broadcast every week, or at least the notification for it, and those who happen upon it in progress.  People who follow the RL Twitch stream and connect to Twitch will see that it’s online, and people who play Rocket League while a broadcast is in progress are greeted with a giant flashing “ESPORTS LIVE NOW” button on the main menu that they can click to watch.

EU Regionals Anomalies

The graphs for the 12 broadcasts this season follow.  Don’t pay attention to the actual numbers yet, just the shapes.  And in particular the last graph on the bottom right, the EU playoffs.


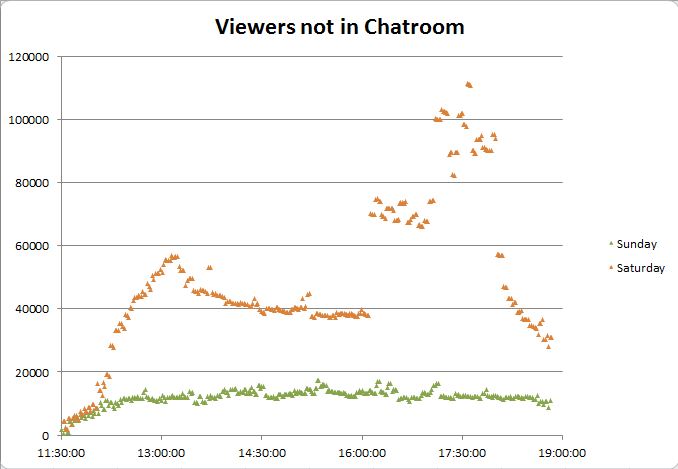
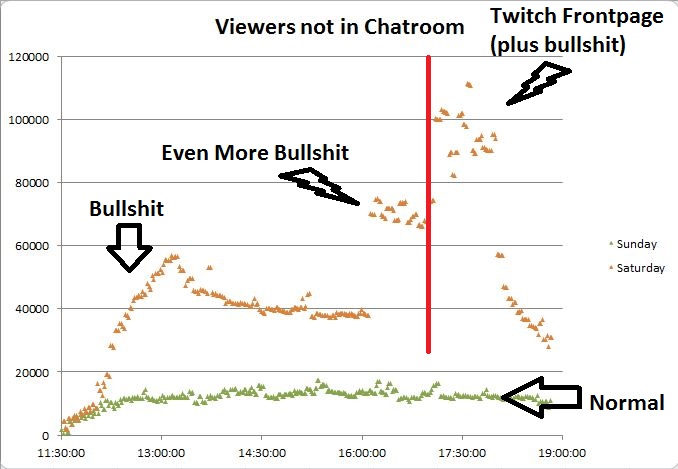
There are two obvious things of note.  First, the glitch on the left is the very end of EU Week 5 (the bottom left image above) and not actually part of the playoff broadcast.  That was confirmed directly by esc.watch.  Second.. well…

S6euwhat

That’s a near-instantaneous (under 5 minute) jump of almost 15,000 viewers, and there’s no precedent of such a thing in any other broadcast this season.  It’s clearly not part of the natural accumulation process.

EU Regionals Low Viewership

The other interesting thing about this broadcast is that it was the least viewed broadcast of the season by a country mile.

RL S6 Viewership by match slot

Or in slightly less cluttered form, for each region, the averages of the regular season (weeks 1-5), the playoffs, and the difference between the playoff viewership and the regular season viewership.

RL S6 averages

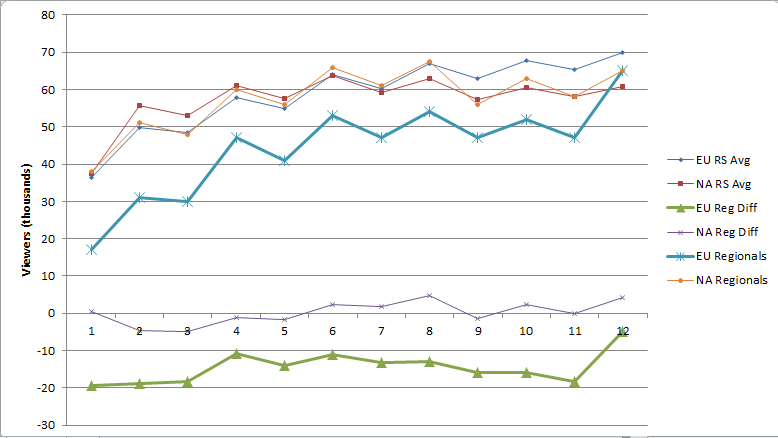
Yikes? To summarize so far, we have a mystery with the following facts

  1. Season 6 EU playoff viewership (Sunday October 14, 2018) was abominably low, off by 10-20 thousand viewers or up to a third of the regular audience, far worse than any other broadcast this season.
  2. Season 6 NA regional playoffs, held the day before (Saturday, October 13, 2018) were exactly in line with seasonal numbers.
  3. Regional playoff viewership was always fine-to-good for the other 7 Season 3-Season 6 regional playoff broadcasts
  4. There was an unnatural 15,000ish viewer bump late in the broadcast.

Potential Causes for Low Viewership

In investigating the low viewership, I was unable to uncover any evidence of technical difficulties.  I was watching the broadcast and using Twitch and both worked fine.  I found no reports of issues, Twitch-wise or internet-wise, in the relevant reddit thread while gripes about the Twitch issues in season 4 were plentiful.  The graph of viewer count was accurate.  I personally observed the extremely low viewer counts throughout as well as the high viewer count at the end.  Unfortunately I wasn’t paying attention to the count as the 15,000 viewers showed up late.  Technical issues don’t seem to be the explanation here.

The second possibility is that something external was drawing would-be viewers away.  There wasn’t any news in the world that day that would have diverted a large number of viewers.  Call of Duty: Black Ops 4 was released worldwide on October 12, but if that were the cause, it should have sunk the NA playoff viewership on October 13 as well.  Similarly, Rocket League itself was offering a double-XP weekend, giving out more in-game rewards for playing, but that was also active on Saturday during the NA playoffs.  There were other non-Rocket League esports events, as there are many weekends, but there didn’t appear to be anything that could uniquely sink the entire Sunday broadcast or the first 90% of it.  This doesn’t appear to be it either.

The third possibility is that the broadcast itself was thought to be uniquely unappealing to tune into, presumably because Dignitas, the two-time defending world championship roster that just went 7-0 in round robin play, was thought to be a lock to win.  This explanation falls short for several reasons.  First, there’s no evidence that Dignitas is bad for viewership at all.  None of their matches have seen strange declines and the last match of the regular season was an almost meaningless Dignitas match and it had the highest viewership of the week. The idea that people would watch to see if Dignitas could go 7-0, then disappear in droves as Dig tried to become the first NA/EU team to go 7-0 and win the regional playoffs… well, that’s just strange.

The format of the regional championship also undercuts that explanation.  It’s a 6-team single elimination where the top 4 qualify for the world championship.  The top 2 seeds get first-round byes and automatically qualify which means the first two matches- #3 vs #6 and #4 vs #5- are critical.  The winner goes to the world championships and the loser is done for the season.  Even if people didn’t want to watch the rest of the playoffs, those matchups should have been compelling.  The second match of the day involved the most anticipated rookie in RLCS history by far, ScrubKilla, and his wildly inconsistent Renault Vitality team playing for a LAN spot.  This should have been a must-watch series, and by one metric it was.  Not counting the first match of the day, which always accumulates lots of viewers, Vitality-PSG had a higher accumulation of viewers (+17k) than any other match had all season, almost 50% clear of second place.  People talked about ScrubKilla and Vitality all season.  Viewers appeared to tune in in numbers specifically to not miss this match.  The final number shouldn’t have been hot garbage, and yet it still was.  I’m at a complete loss for a legitimate explanation for the overall low viewership.

Potential Causes of the 15,000 Viewer Bump

Switching focus to the ~15,000 viewer bump, there’s one legitimate explanation- a large stream from another game/scene hosted them..  That would bump the viewer count up quickly, but I could find no evidence of that actually happening.  I couldn’t find a mention on twitter. I watched the relevant portion of the broadcast replay, focusing on the Twitch chat (bless my soul), and there weren’t any mentions of a host, nor any newbie-like comments, which seems a bit unlikely.  In addition, the attrition rate would have had to have been extremely low because viewership also went up a tad after the spike.  Rocket League being the autoplay stream on the Twitch homepage was suggested as a possibility, but after observing those streams for a few days, none I saw were accumulating viewers at even a meaningful fraction of the necessary rate.

If the 15,000 viewer bump isn’t natural viewer accumulation, and isn’t a legitimate Twitch host, that leaves fraud.  Psyonix randomly gives away in-game items to players who watch the stream and have their Twitch accounts linked.  This is absolutely a boon to viewership, and can be misleading in a way because players can and do load the stream, mute it, and pay no attention to it just for the chance of getting a drop. In this way, the percentage of the viewer count who are watching the stream is lower than it otherwise would be, but this is all out in the open, and it does also further a legitimate purpose of trying to entice players to become esports viewers.  Where there are giveaways, there are people trying to exploit giveaways, but the likelihood of large-scale fraud here seems very small to me.  The expected value in terms of reselling items of having a linked account watch a stream for 6 hours is about 25-50 cents (USD), and obtaining that value across thousands of accounts involves selling numerous small-ticket (.50-$3) items that nobody wants multiples of.  While I have no doubt that some people sign up a few accounts and have Twitch open in multiple browsers, any person or group capable of controlling enough computers/IPs to generate 15,000 concurrent fraudulent Twitch views should be able to make a hell of a lot more money doing almost anything else with them…

Such as selling their services to a company/streamer that wants to inflate its viewer count to bring in more advertising/sponsorship revenue or to just appear to be more popular than it actually is.  This is called viewbotting, and it’s not a rare occurrence.  If Psyonix had an arrangement for around 15,000 viewbots and forgot to turn them on before the last match, or never turned them on and got a 15,000 viewer host near the end, this would explain everything.  Here’s the graph from earlier with 15,000 viewers added through the whole broadcast instead of the very end.

RLS6 +15k

That would be much more consistent with the regular season.  I obviously have no affirmative proof that Psyonix is committing viewbot fraud, but if they were committing viewbot fraud, this is *exactly* what it would look like if they screwed up for a week, and I’m at a complete loss for legitimate explanations for the low viewership that wouldn’t also have sunk the NA playoffs.

In summary, the evidence here is consistent with several main hypotheses of varying plausibility.

  1. There is a legitimate, as yet undiscovered reason for the overall low viewership and they got a big host of around 15,000 near the end.
  2. Psyonix is viewbotting around 15,000 fakes and forgot to turn them on until the last match of the day.
  3. Psyonix is viewbotting around 15,000 fakes, forgot to turn them on at all that day, and coincidentally got a big host of around 15,000 near the end.

Psyonix’s Refusal to Comment

I contacted Psyonix a fourth time with the article up to this point and another request for comment.  That’s private messages to Murty Shah and Cory Lanier, the two main public faces of their esports program, an email to Psyonix’s general PR contact address, and an email to Psyonix’s esports contact address, and I’ve received no replies.  In addition, they didn’t comment in reddit threads where the low viewership and the big bump were discussed.  The lack of response has to be considered deliberate at this point.  Let’s think about what that means.

Hypothetically, if Psyonix knows the viewers are from a host, would they be willing to tell the world about it?  I would think so. I’m not a social media guru, but if somebody from a different game added 15k viewers to my 48k viewer broadcast, I would want to say thank you, and I’d want to say it publicly to attempt to engage their followers a little more.  They shouldn’t do that for small hosts because that would bring a barrage of useless attention-seekers, and I’m not sure exactly where the acknowledgment line should be drawn, but a 15,000 viewer host seems safely big enough at this point.  Furthermore, there’s no obvious benefit to attempting to conceal that a host happened.  It would already be known to the people watching the other stream, it’s obvious to everybody who looked at the viewer graph that something happened, and it’s inconceivable to me that a channel from a different scene wanting to expose its viewers to Rocket League could be construed negatively.  Now watch it turn out that Psyonix is slowrolling and waiting for the article to go live to say who the host was, but I have to work with what I have so far. If they do decide to announce who the host was and it’s legit, then we’re just back to the mystery of the low viewership in general.

Hypothetically, if Psyonix knows the viewers are fake, would they be willing to deny that they were hosted or willing to lie about who hosted them?  The latter would be a huge mistake because it would be discovered in no time flat, and the former is straight-up admitting that the numbers for that broadcast are bogus, and by inference, that the numbers for every other broadcast during the season are almost certainly bogus. They have to stay silent in this case and hope it blows over.  Twitch itself should have an active interest in investigating this broadcast if there wasn’t a big host.

Reasons for Viewbotting

The cleanest explanation for not commenting is fraud, which invites the question of whether or not viewbotting would make any sense.  As a moral matter, I have absolutely no idea if the relevant people working there are the type who could do such a thing.  As a business matter, it’s plausible.  Before this season, viewership trends started out ok and then took a straight-line path to dumpster fire.  All tournament pairs below are roughly equivalent across seasons.  Broadcasts were about the same length and Fan Rewards were active for all referenced broadcasts.  This is what Psyonix was looking at for average viewers as the numbers rolled in this year

  1. April 22.  RLCS Season 5: 68.2k, +15% over season 4
  2. May 6.  Promotion/Relegation Tournament.  44.5k, +9% over season 4
  3. June 10.  World Championships.  101.8k, -5% from season 4 and -14% from season 3
  4. August 11.  UORL 2 final qualifiers. 15.1k.  esc.watch doesn’t have comps for last year, and timeslots are wonky, but this is not a good number at all for top players playing with rewards active.  The peak viewership was only 29.5k, presumably on one of the four good weekend timeslots.
  5. August 26.  Universal Open 2.  29.1k, -35% from last year
  6. September 2.  Season 6 play-ins 42.0k -46% from last season.

If I were in charge of the esport or somebody whose job/livelihood depended on the continued success of the esport, I would have been very nervous going into season 6. It’s not hard to see the appeal of buying some “insurance viewers” in that climate. As it was, season 6 viewership was officially down 20% across the board, and the real number is much worse if this season was being viewbotted.  To repeat one last time, I have no definitive proof that viewbotting took place.  It is only a hypothesis that explains viewer stats and Psyonix’s behavior.

Conclusion

I hope, and all fans of Rocket League probably join me in hoping that there was a legitimate reason for the low viewership and that Psyonix is simply being obnoxious refusing to acknowledge a large host.  Anything else would be a huge story and a crippling blow to the future of the esport.  If Twitch or Psyonix comment, the article will be updated to reflect that. Many thanks to esc.watch for providing the charts for this article.